Uncertainty, sampling error and confidence intervals
Lecture 3
2025-03-31
Tree heights in a forest
Simulated population
- Population \(N\) = 20000
- Sample \(n\) = 100
- Trees sampled at random using a random number generator to provide coordinates
- Closest tree to that coordinate was measured
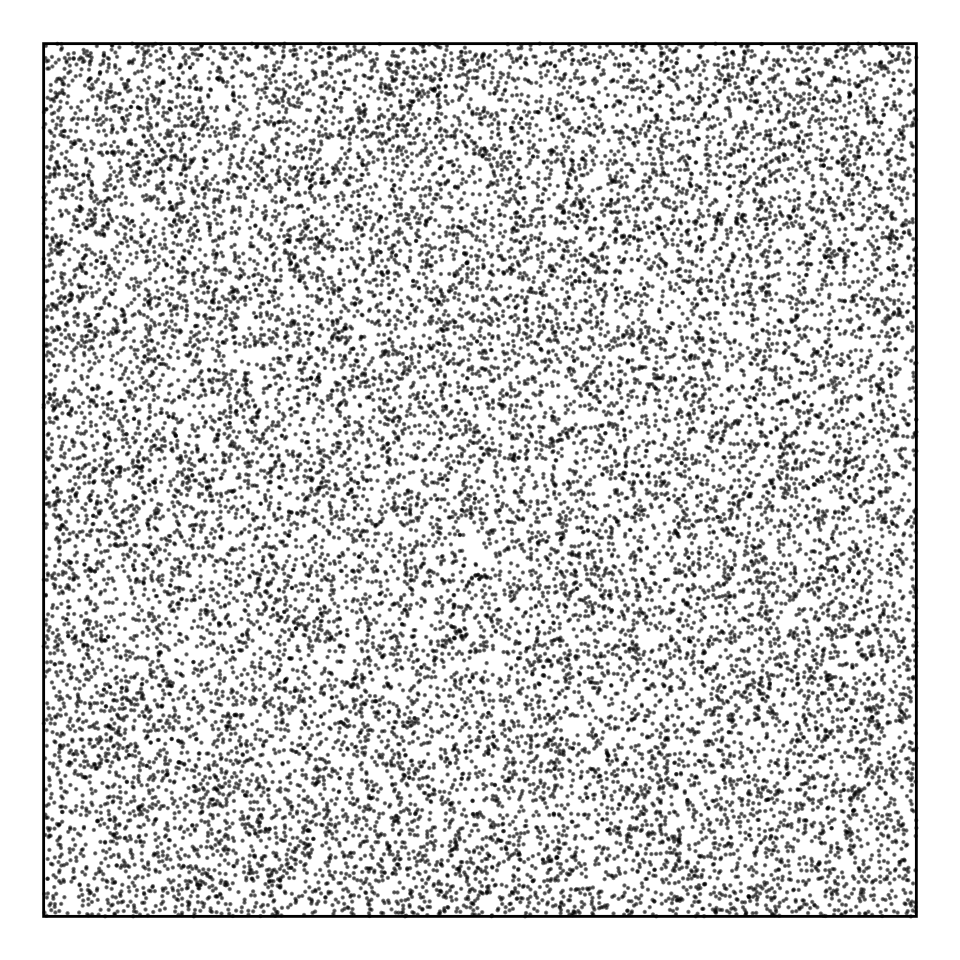
Tree heights in a forest
Simulated population and sample(s)
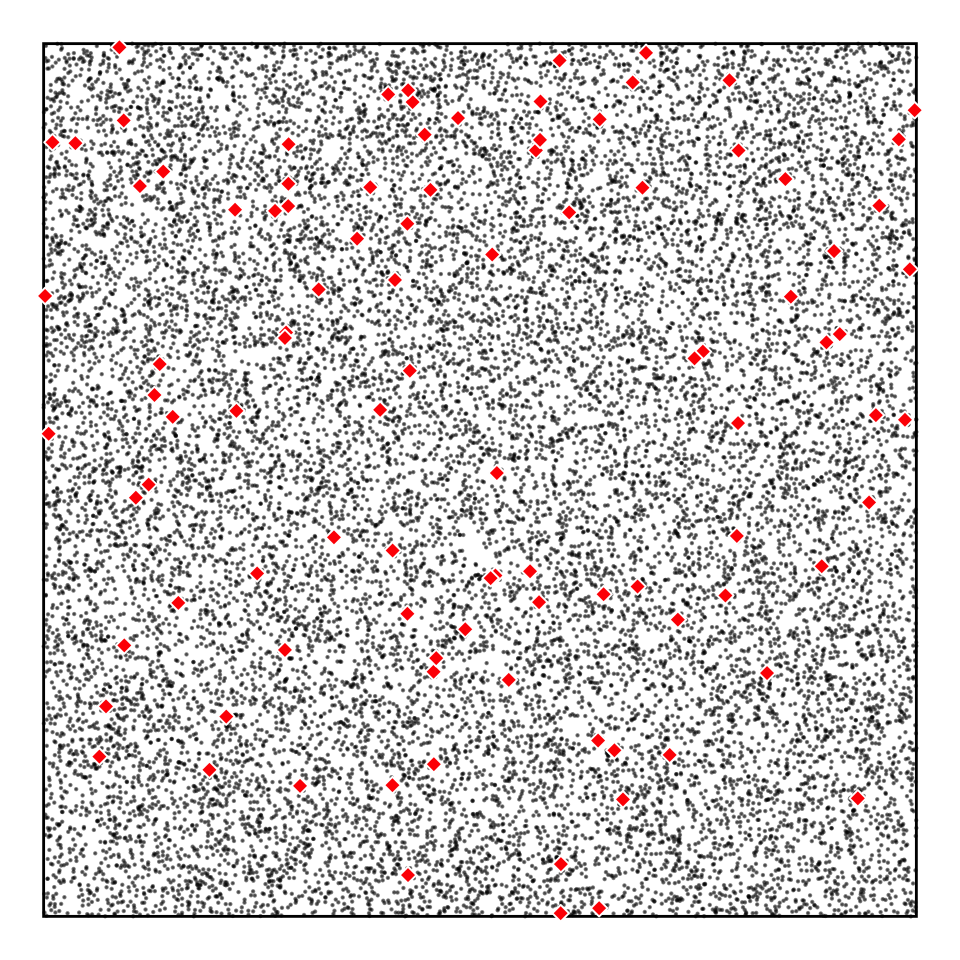
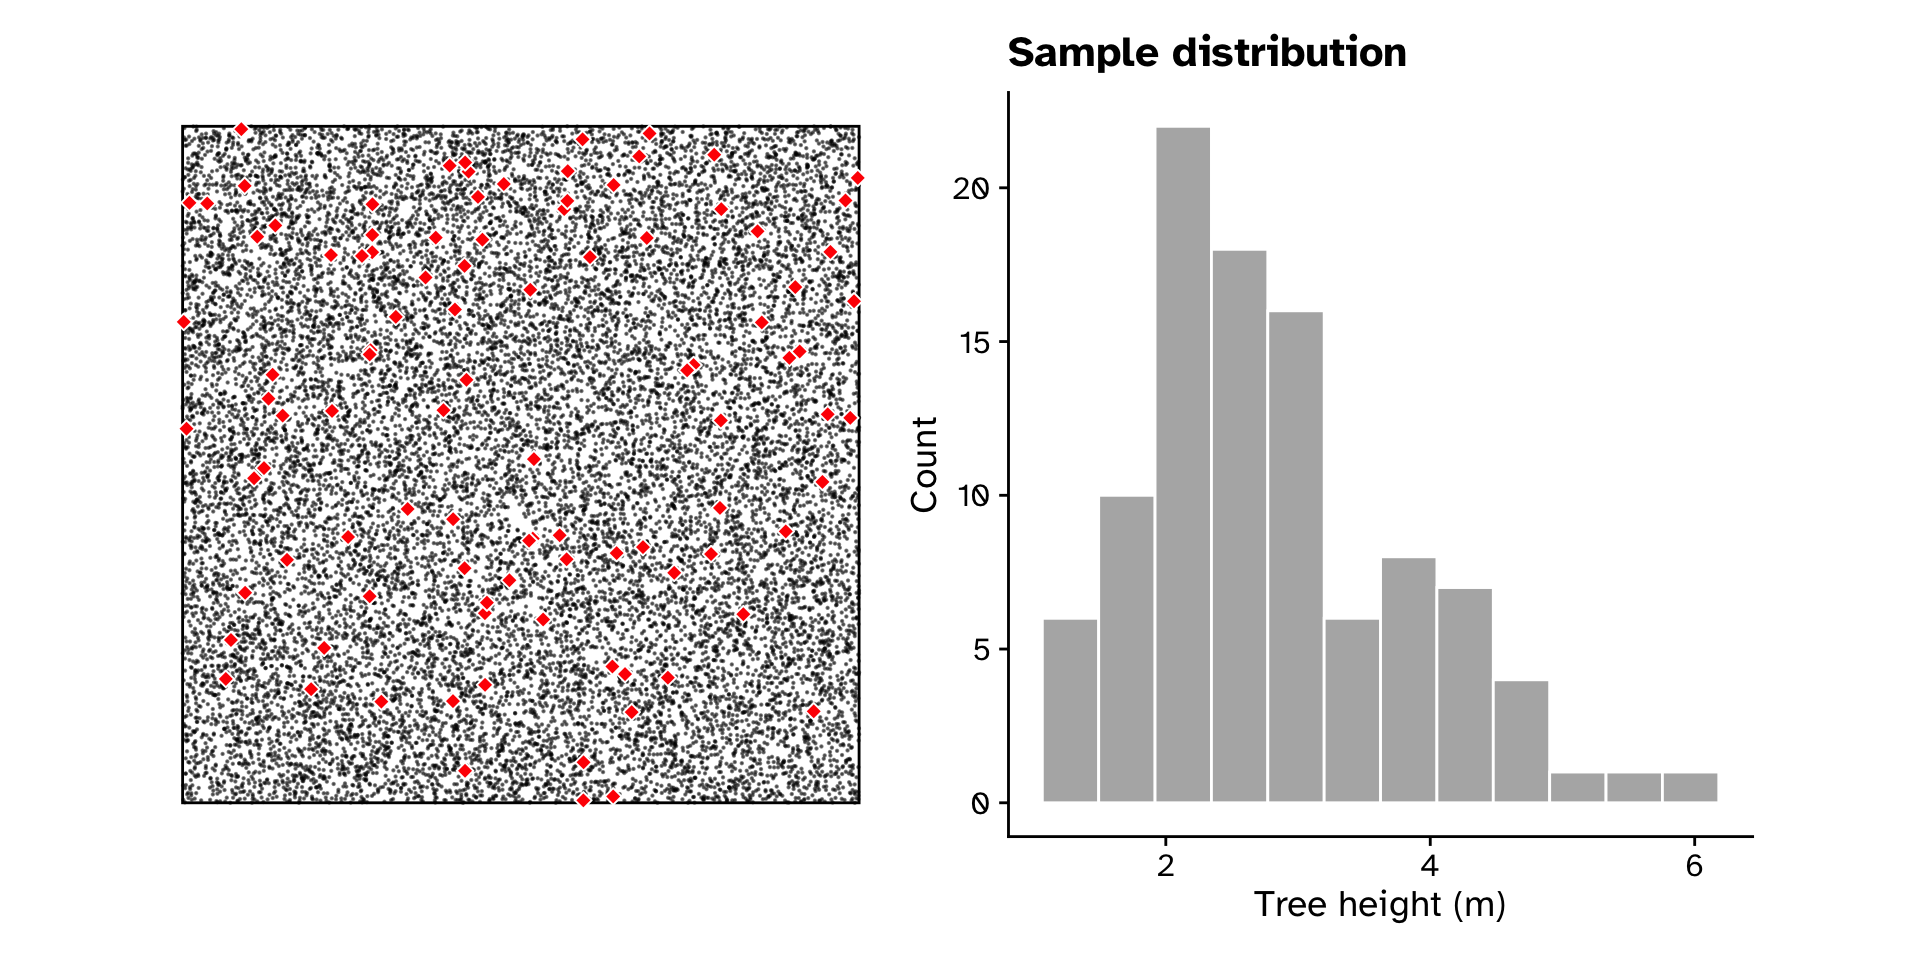
Tree heights in a forest
Simulated population and sample(s)
Tree heights in a forest
Sample distribution
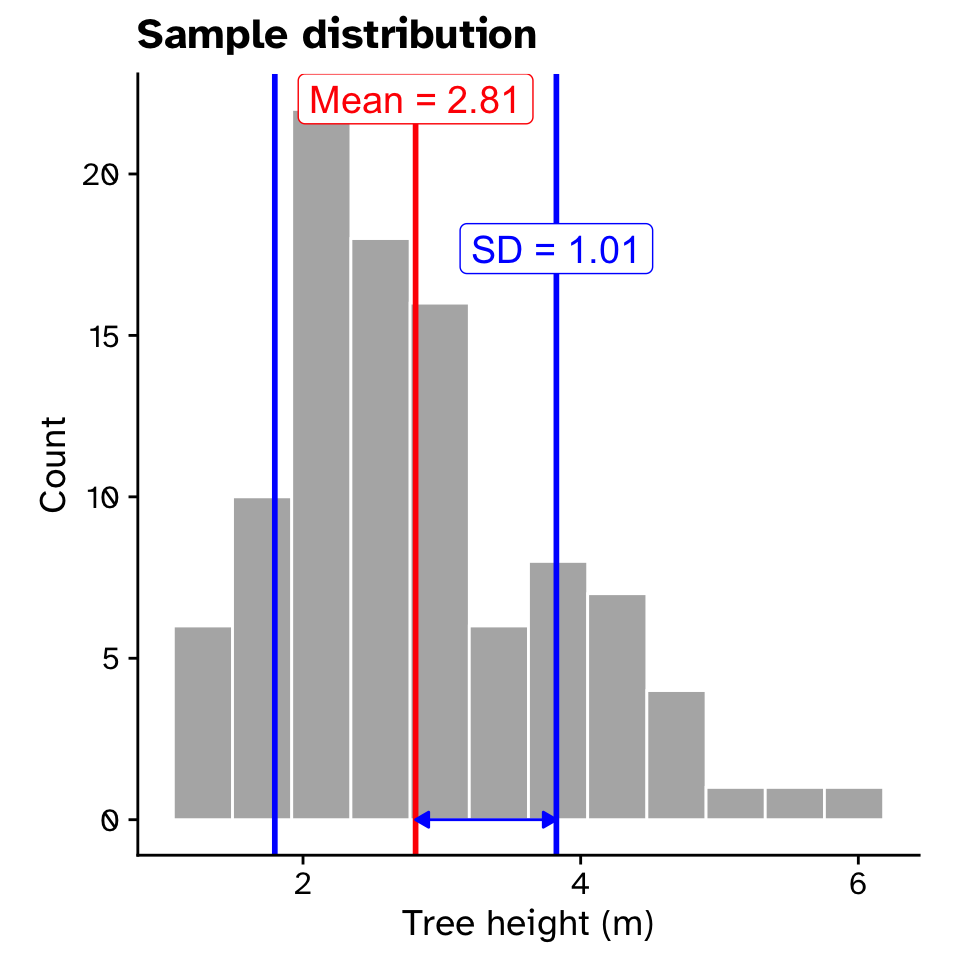
Tree heights in a forest
Observed statistics
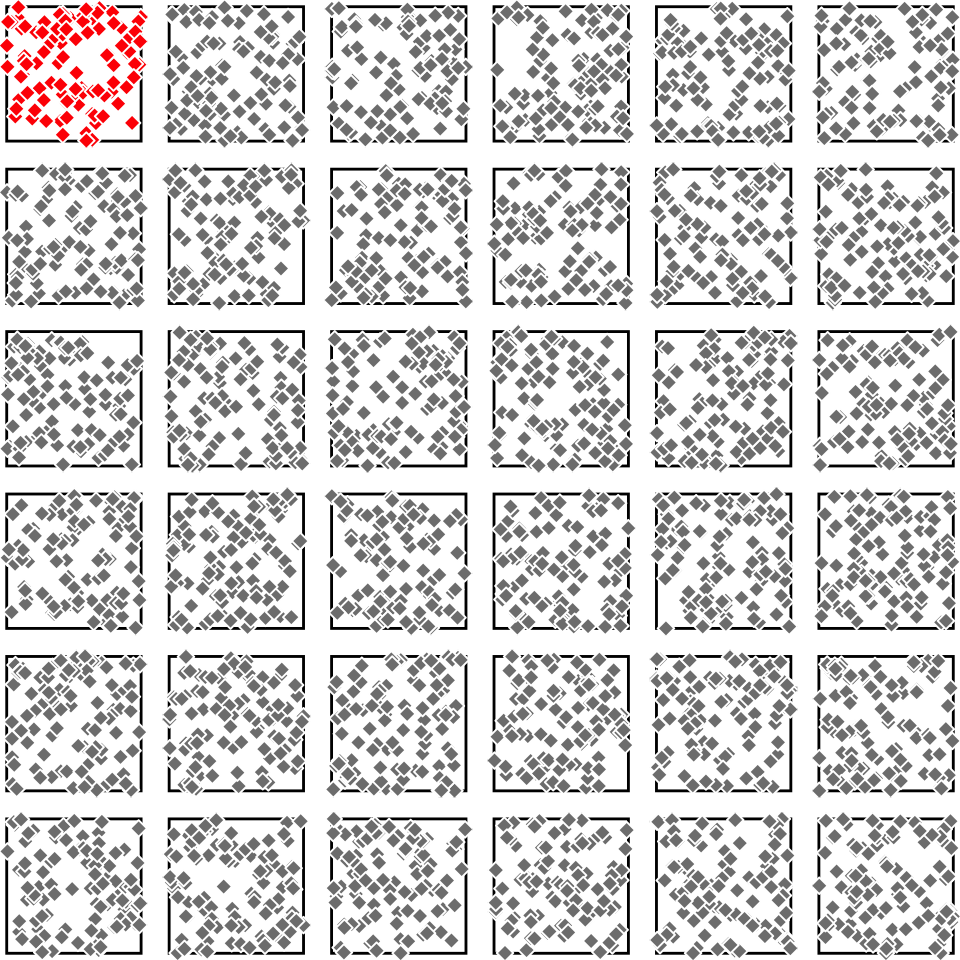
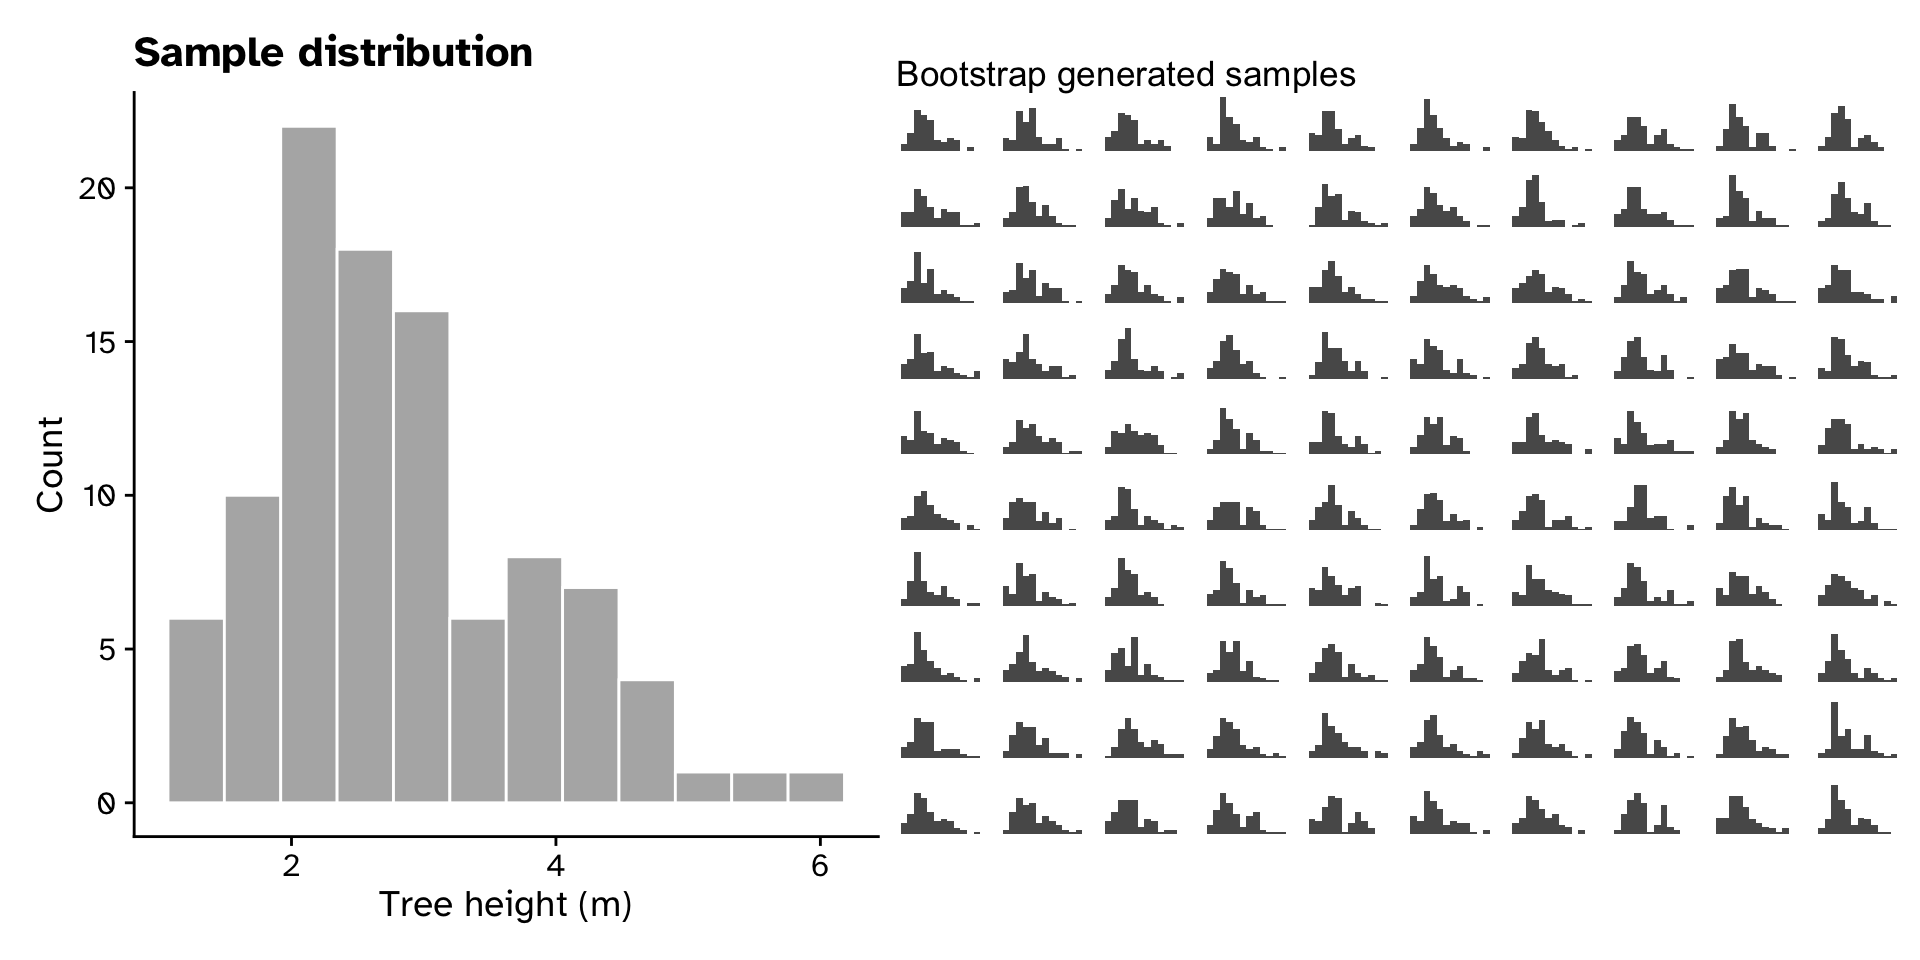
Tree heights in a forest
Generating a bootstrap sample
Tree heights in a forest
Calculate statistics from bootstrap sample
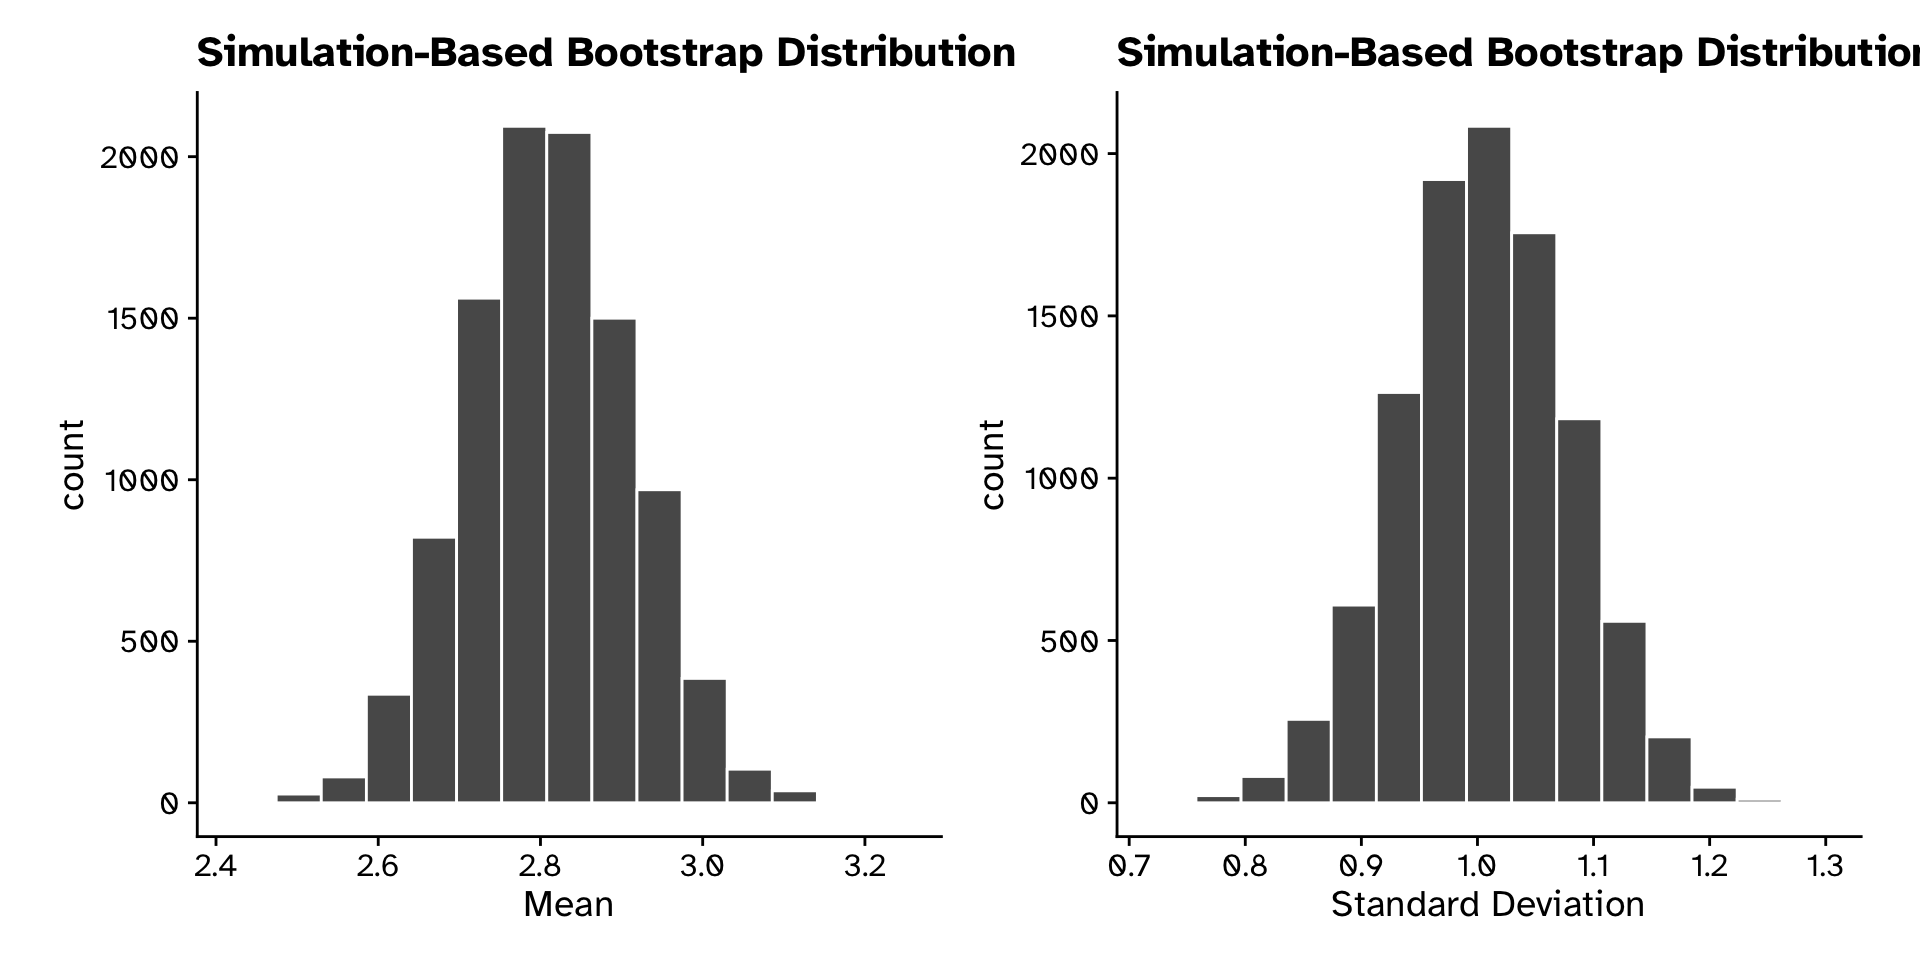
Tree heights in a forest
Calculate statistics from bootstrap sample
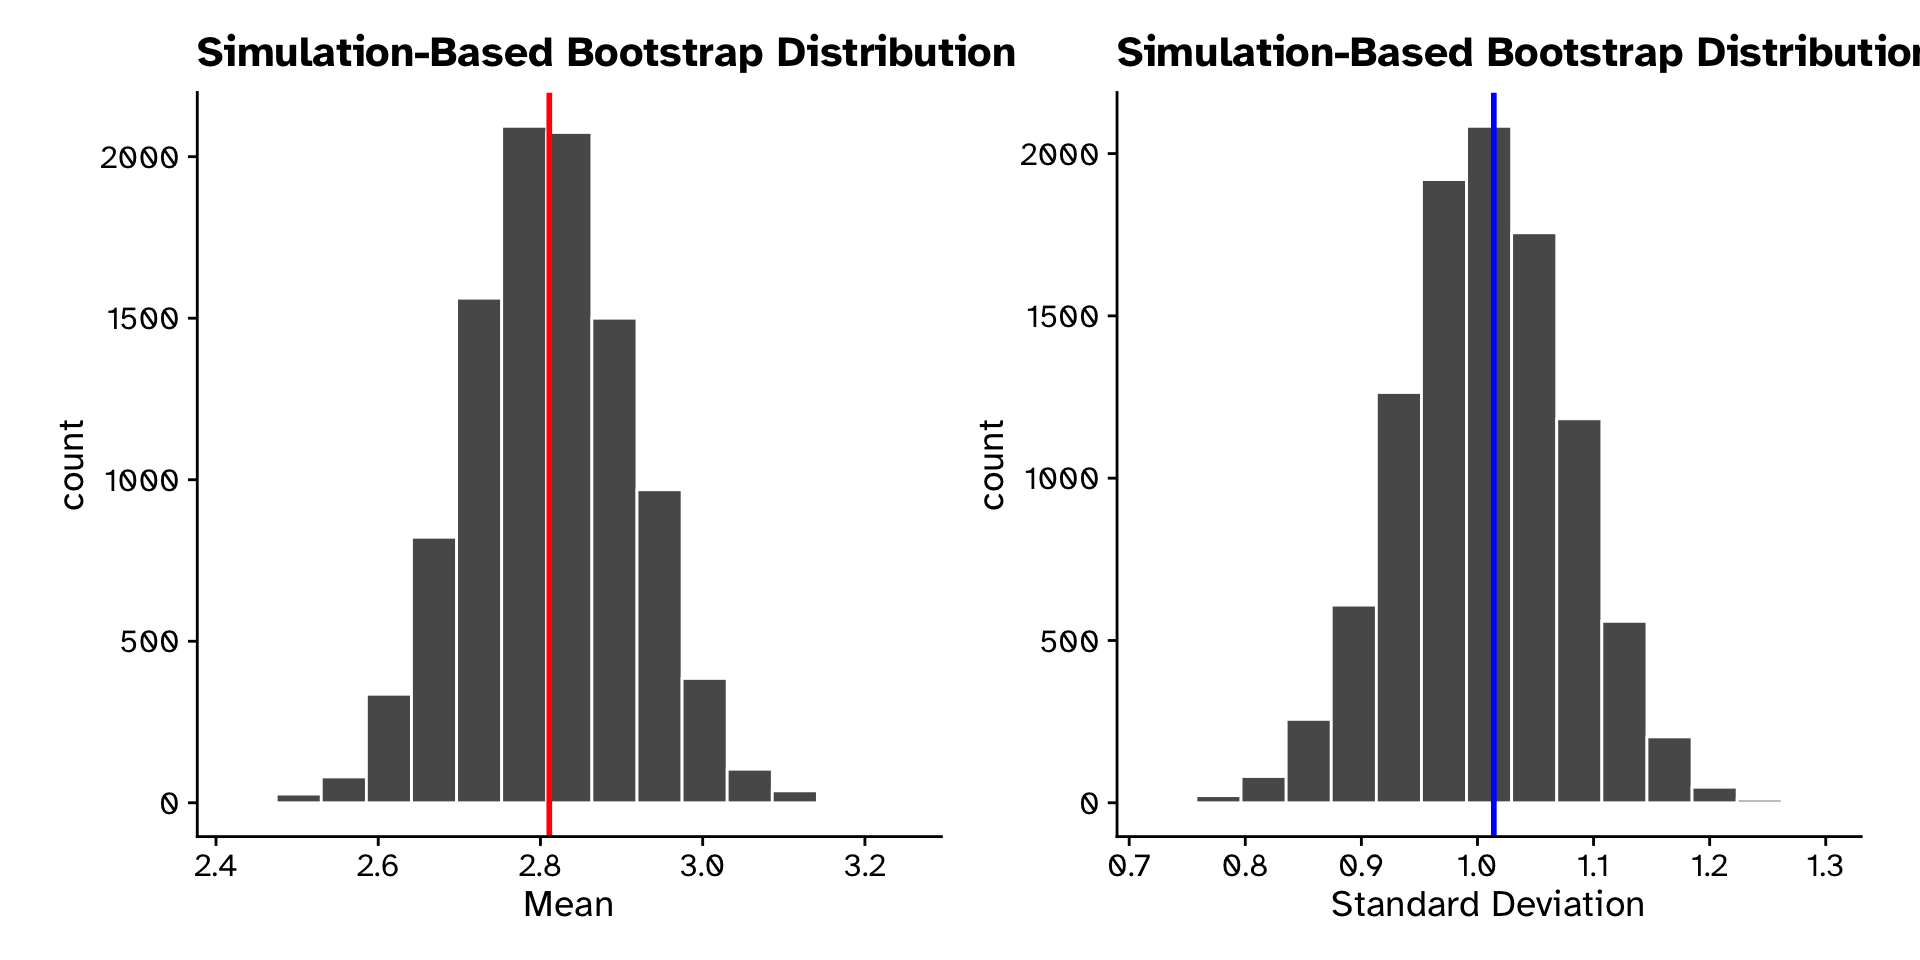
Tree heights in a forest
Calculate 95% CI from bootstrap sampling distribution
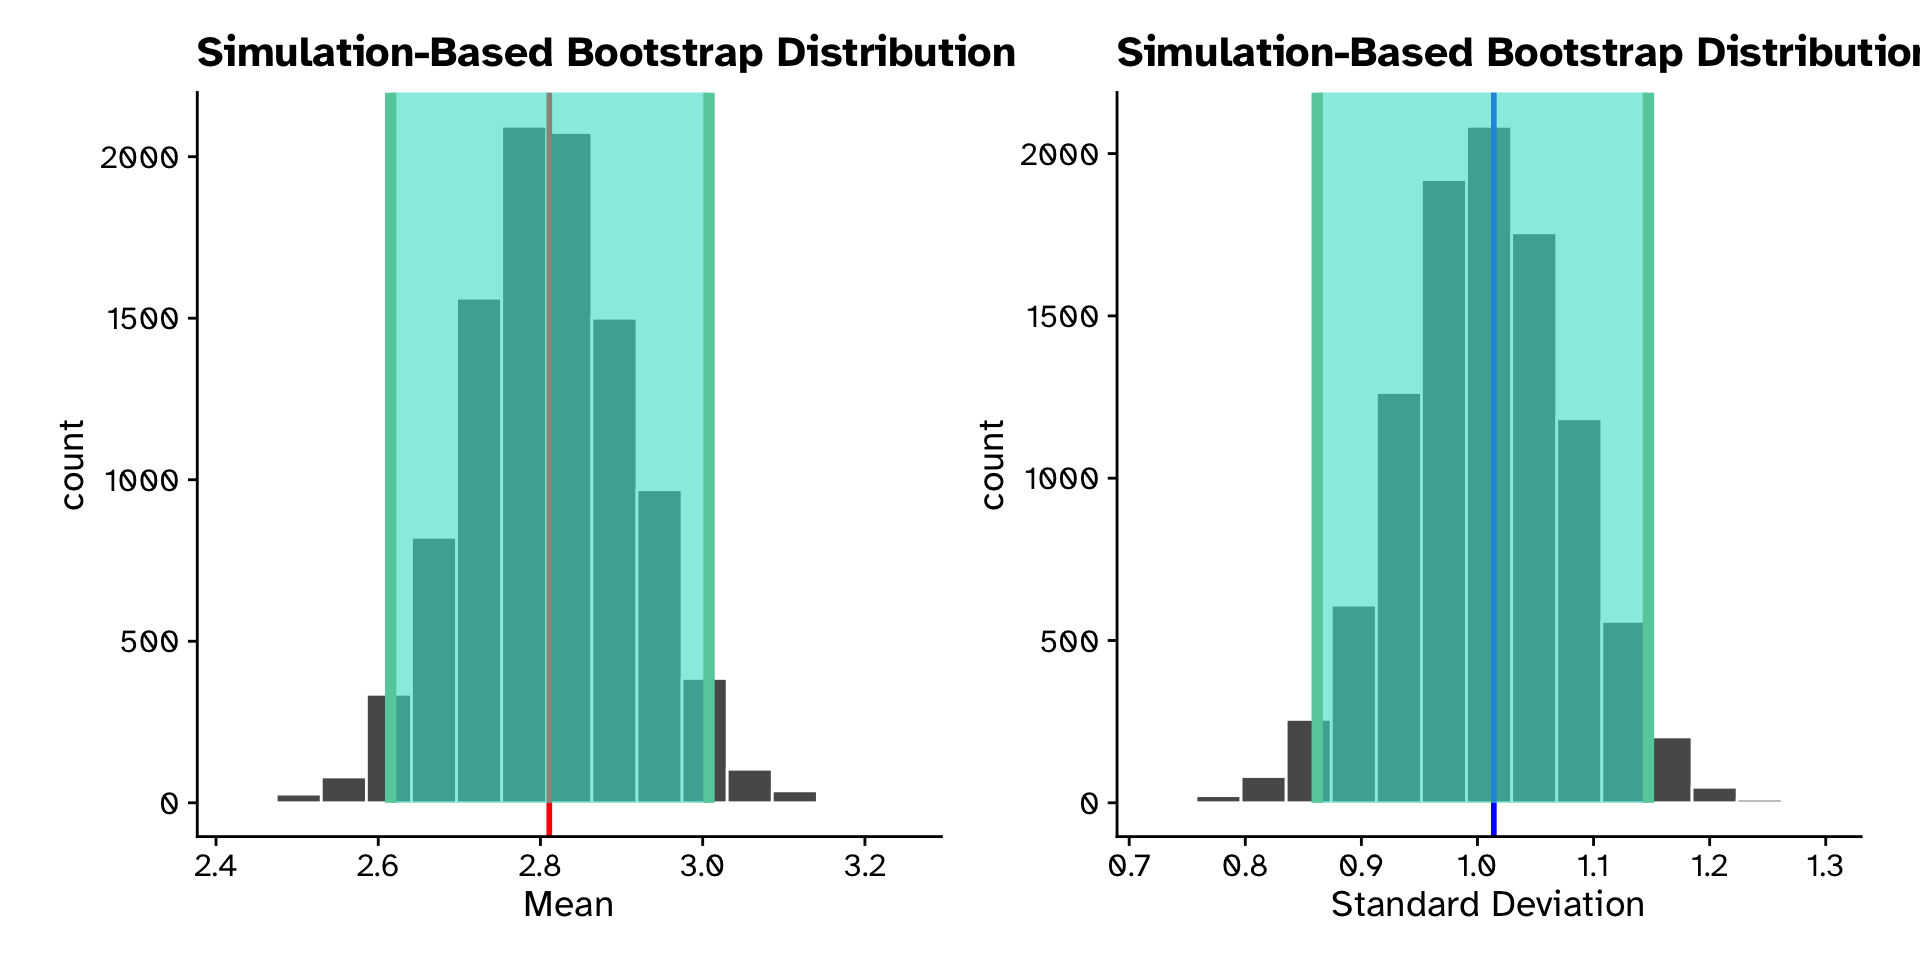
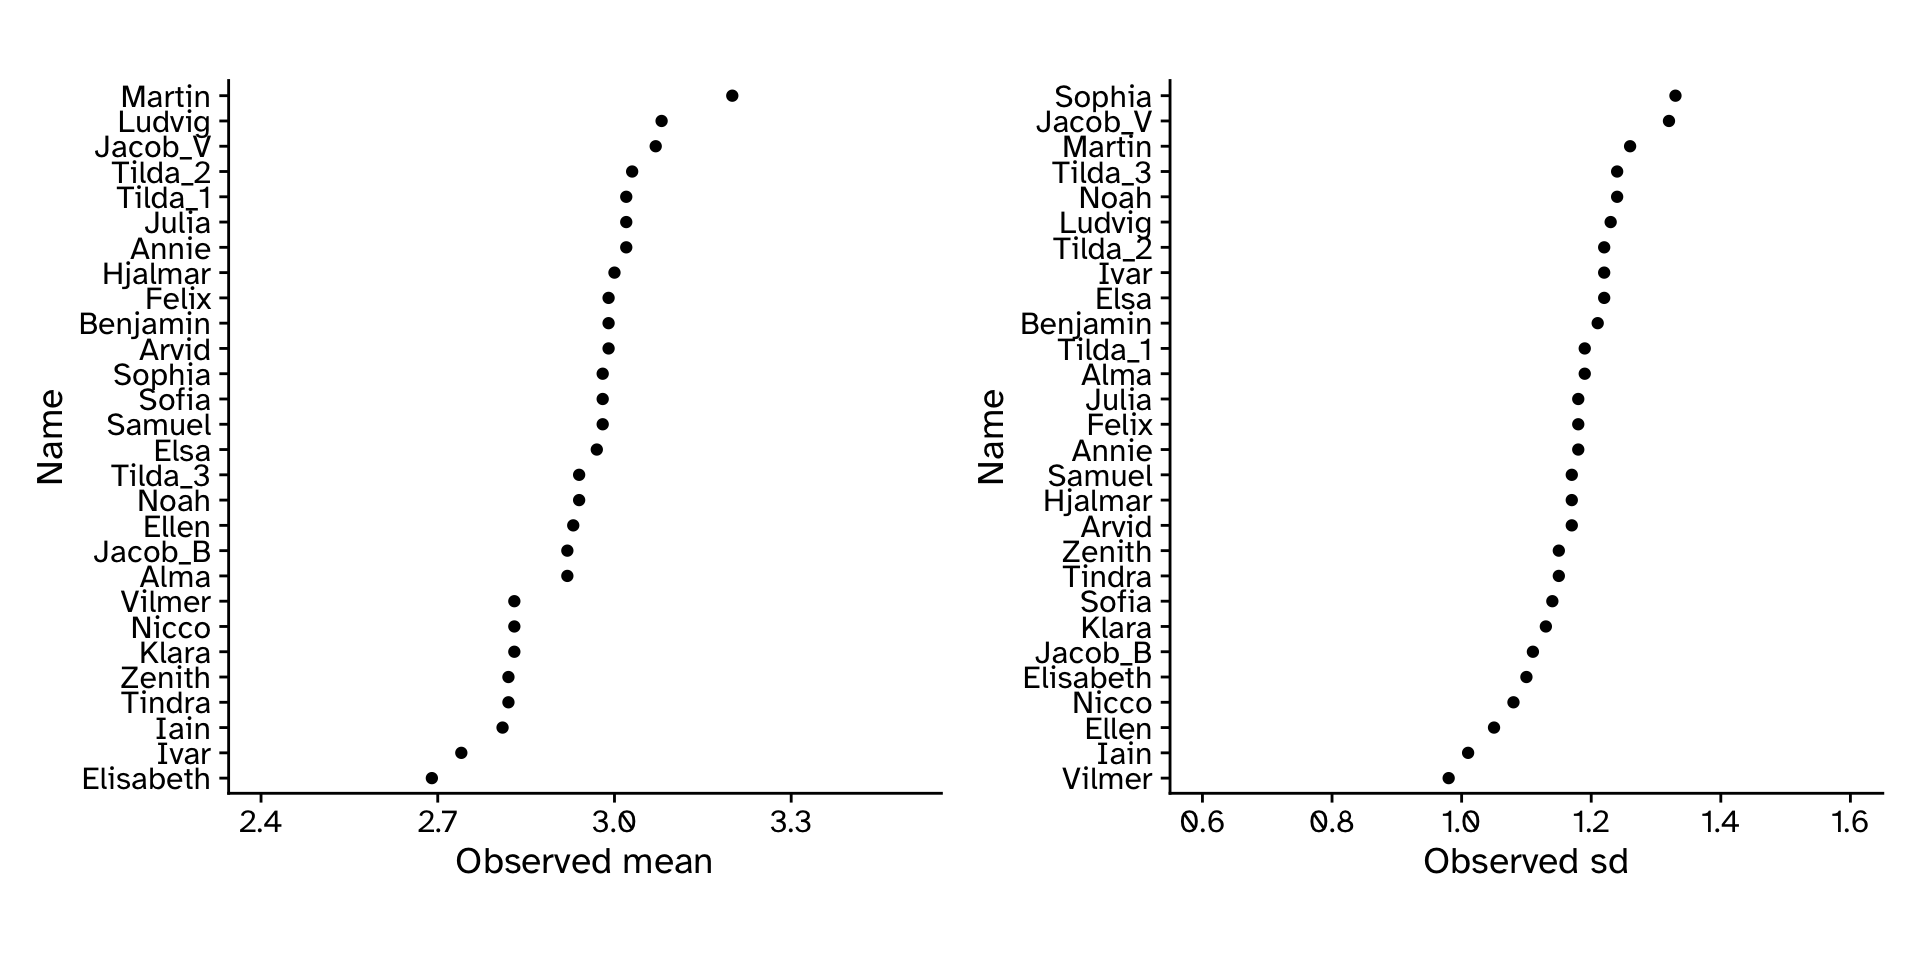
Tree heights in a forest
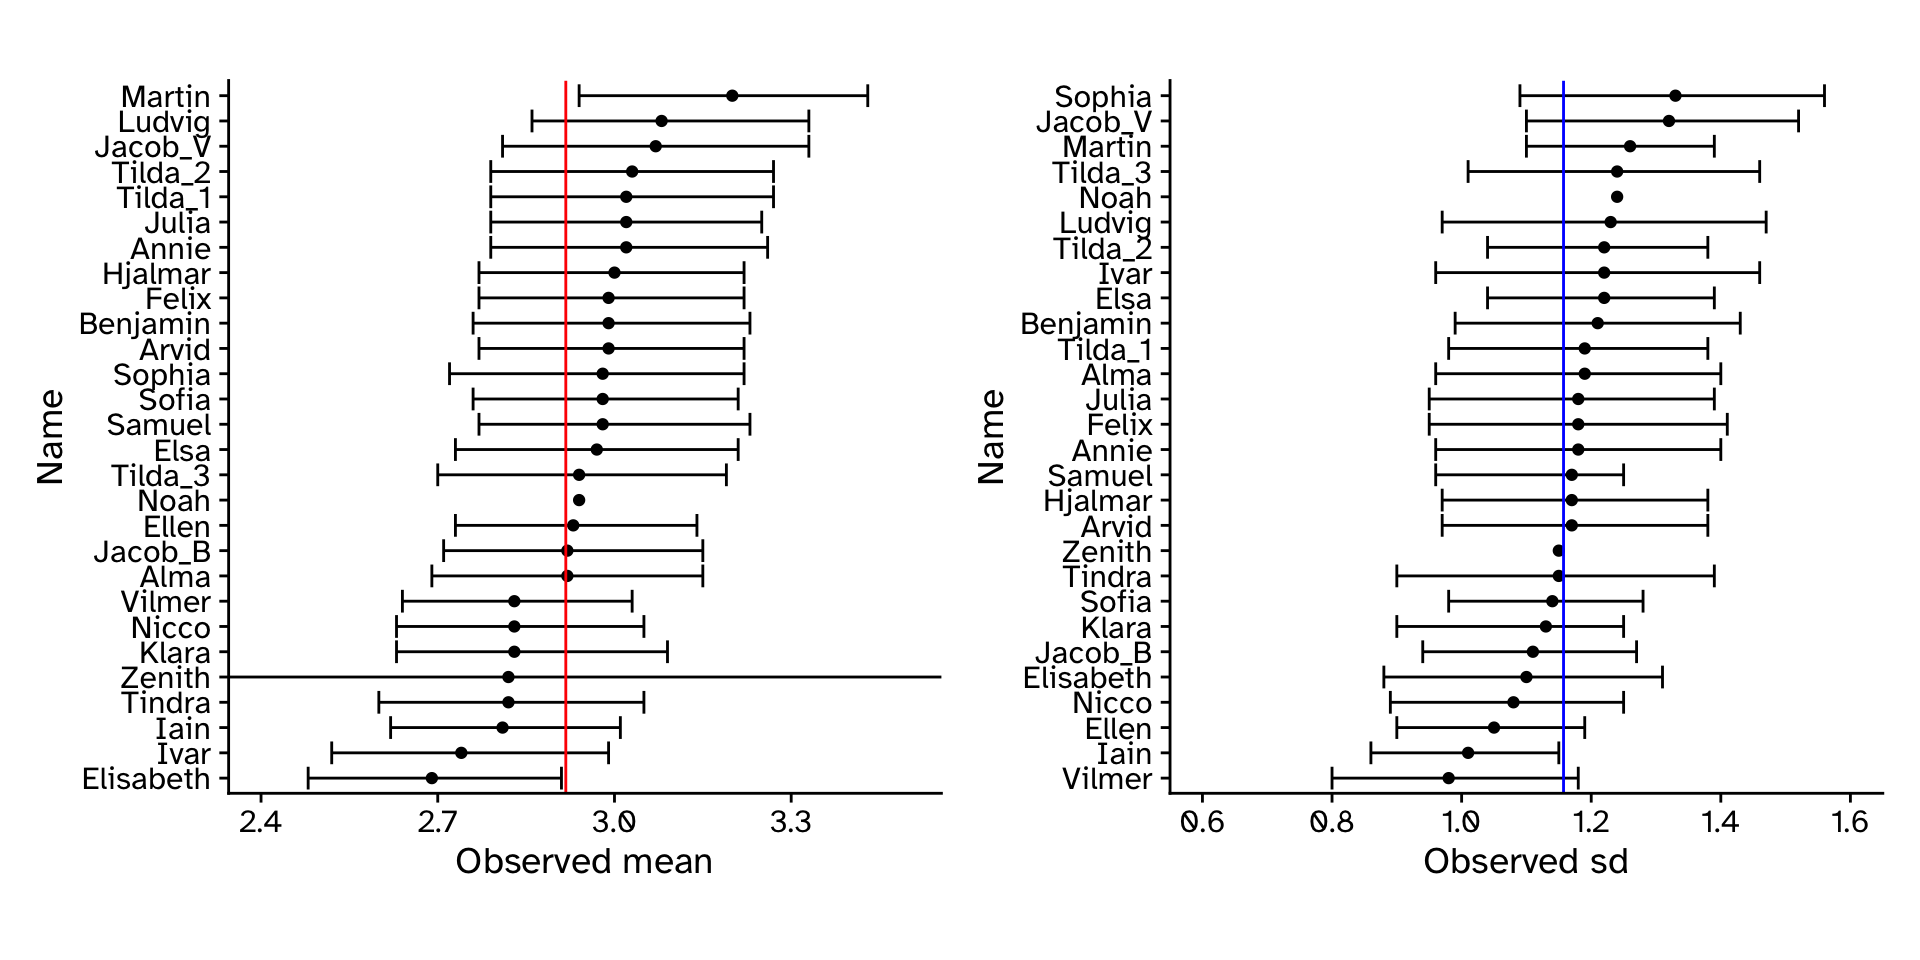
Unusual scenario: we have multiple samples

Tree heights in a forest
Unusual scenario: we know the populations true parameters

Tree heights in a forest
How well did our approach work?
Tree heights in a forest
How well did our approach work?
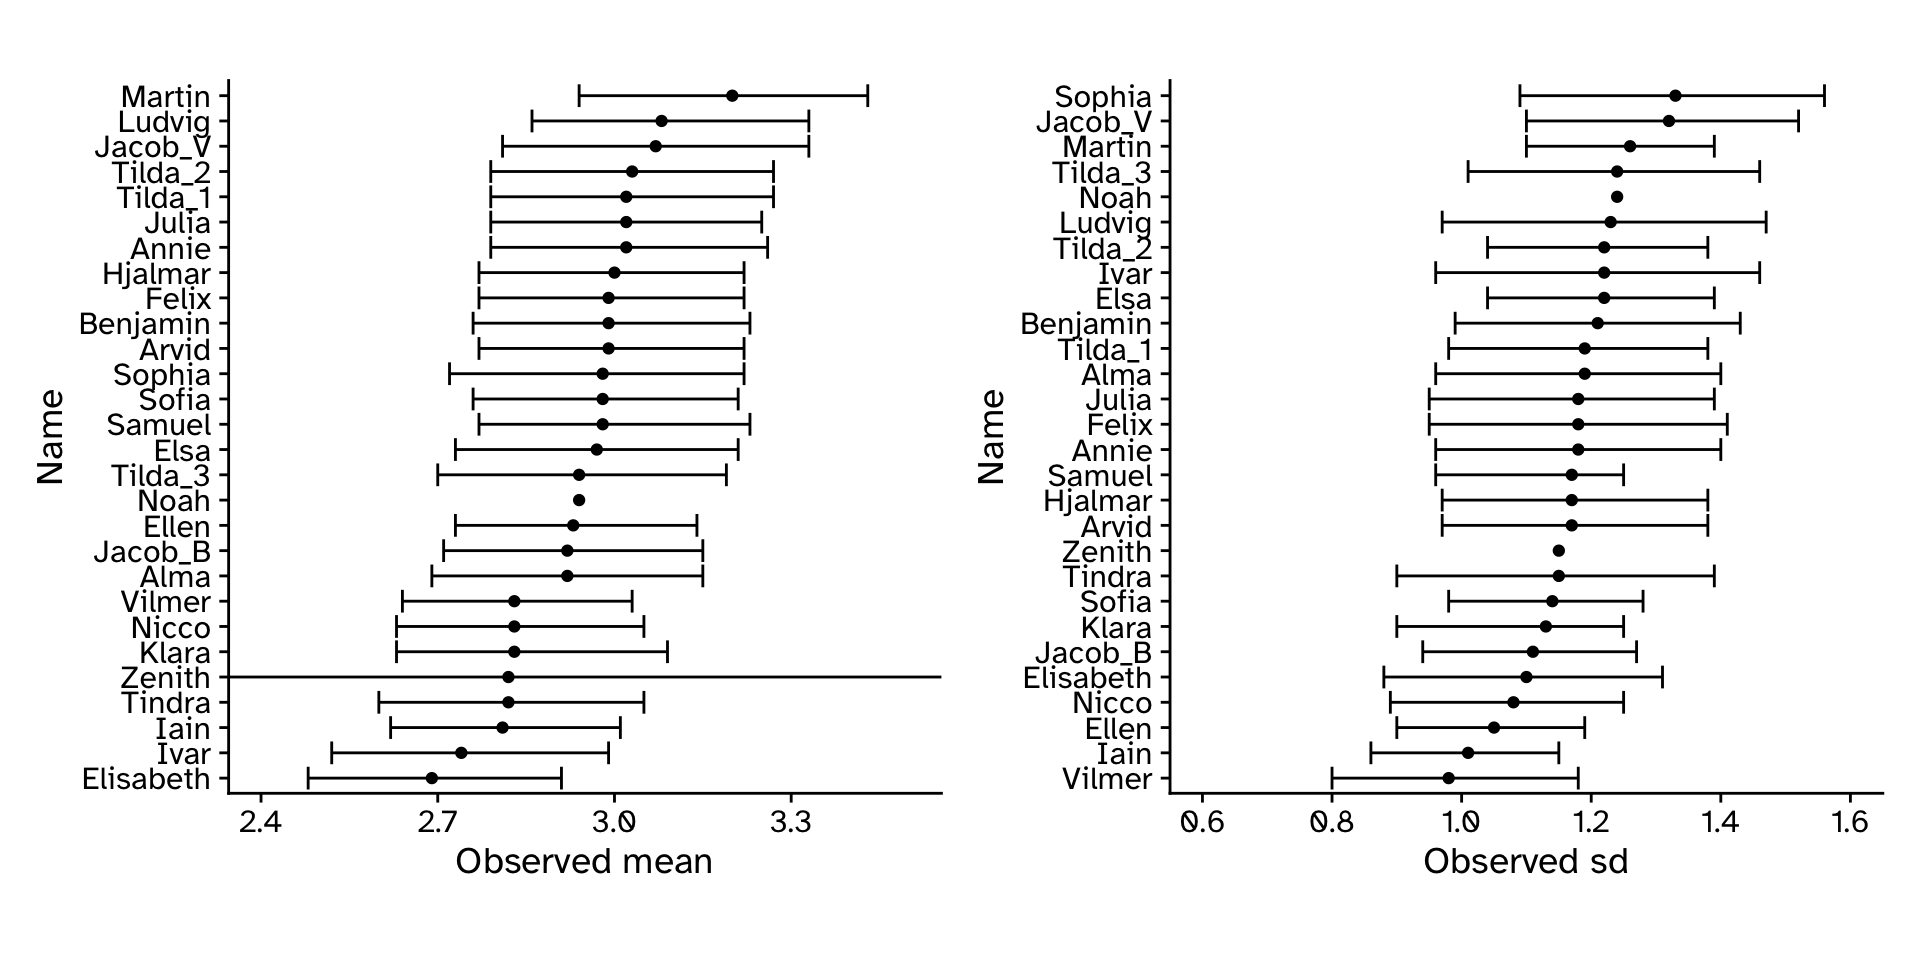
Tree heights in a forest
How well did our approach work?