The scientific method & experimental design
Lecture 3
Thursday 26th March, 2026
Populations and samples
Why we collect data
- Recording some kind of observation or measurement
- Example:
- Measuring the heights of different trees in a forest
- Measuring the carbon in the forest soil at different locations
- We want to say something about the forest in general
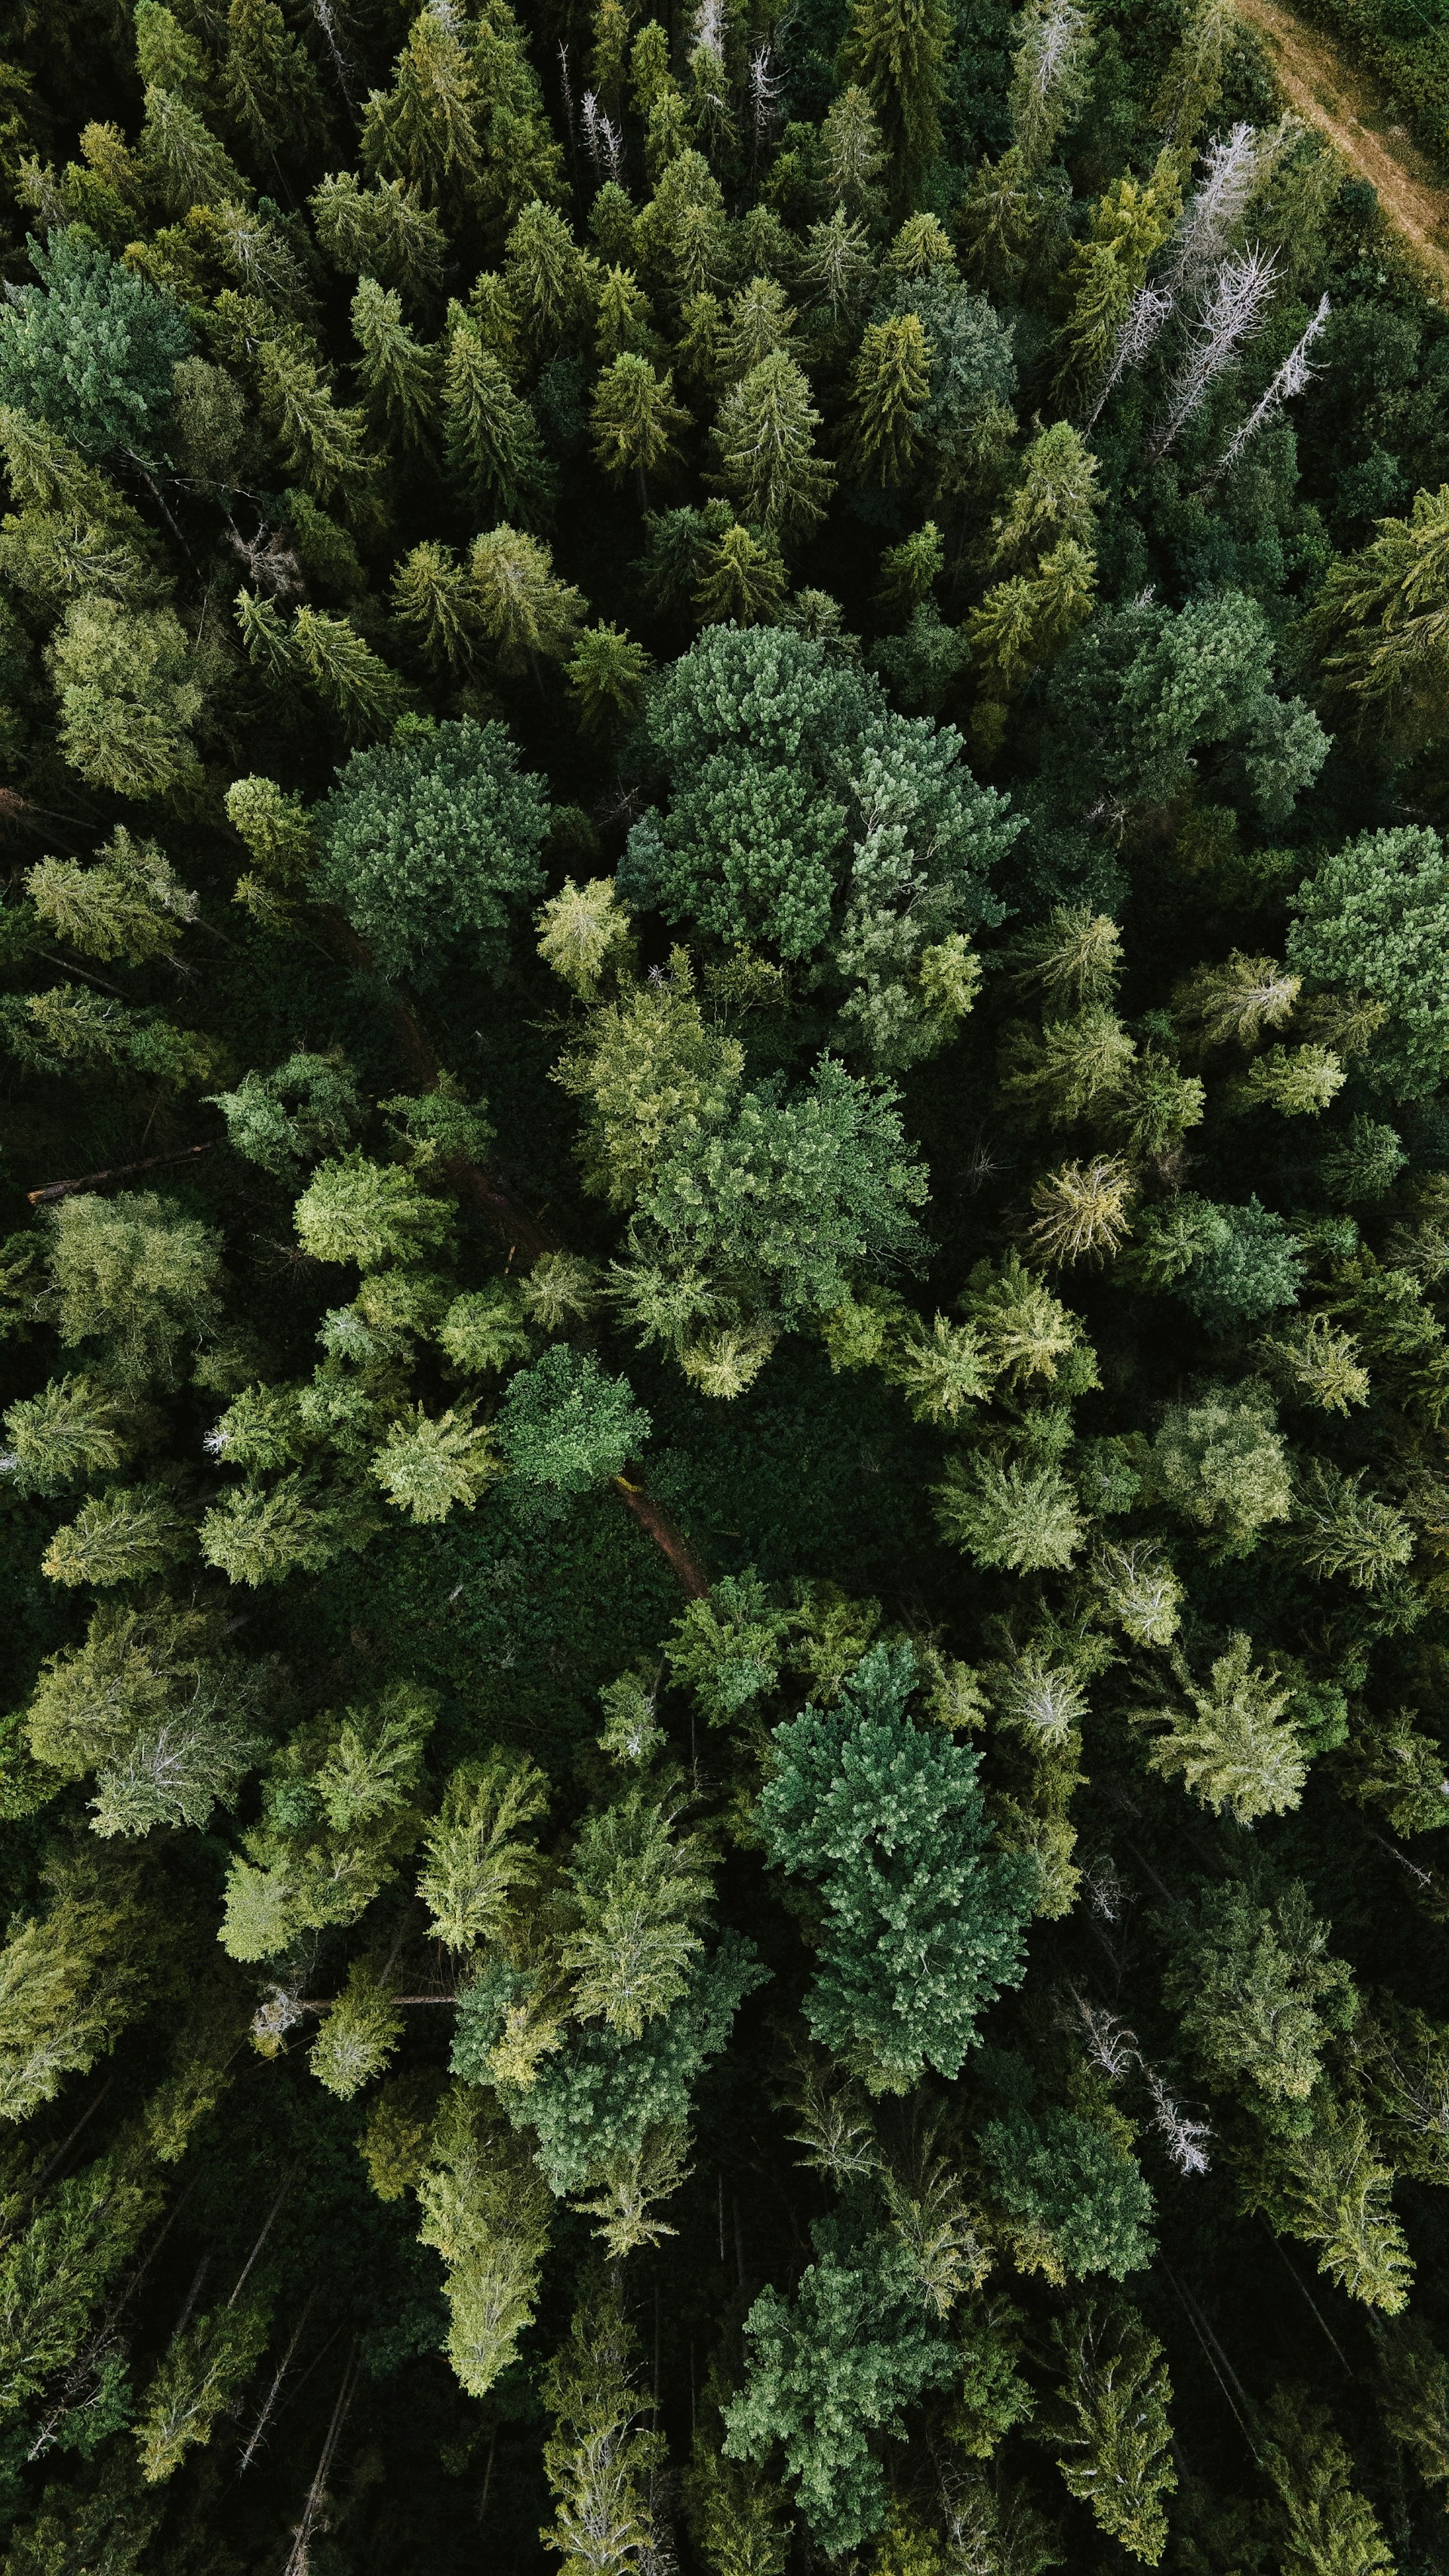
Photo by Olena Bohovyk
Populations and samples
Why we collect data
- Cannot measure every tree or soil at every location
- Instead, we collect a sample of data
- Use the sample to draw conclusions about the population
- Statistics allows us to approximate properties of entire populations from a limited number of samples1
Photo by Olena Bohovyk
Populations and samples
How to sample from a population
How could we collect a representative sample of:
- Students currently studying at the Department of Biology?
- Students across the whole university?
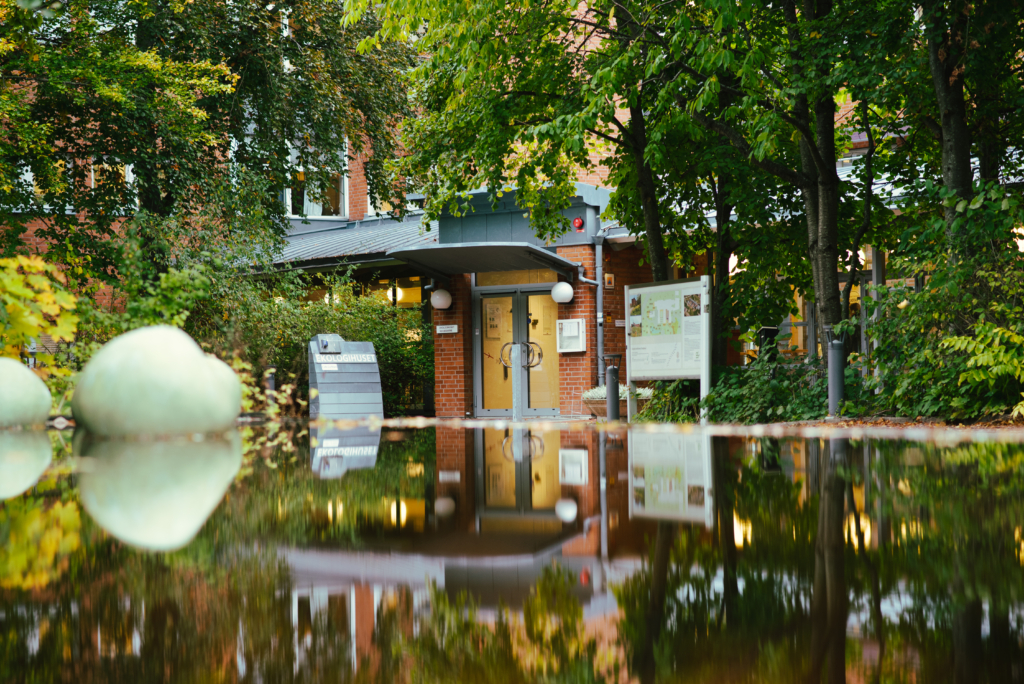
Photo by Alexandra Roslund
02:30
Populations and samples
How to sample from a population
How could we collect a representative sample of:
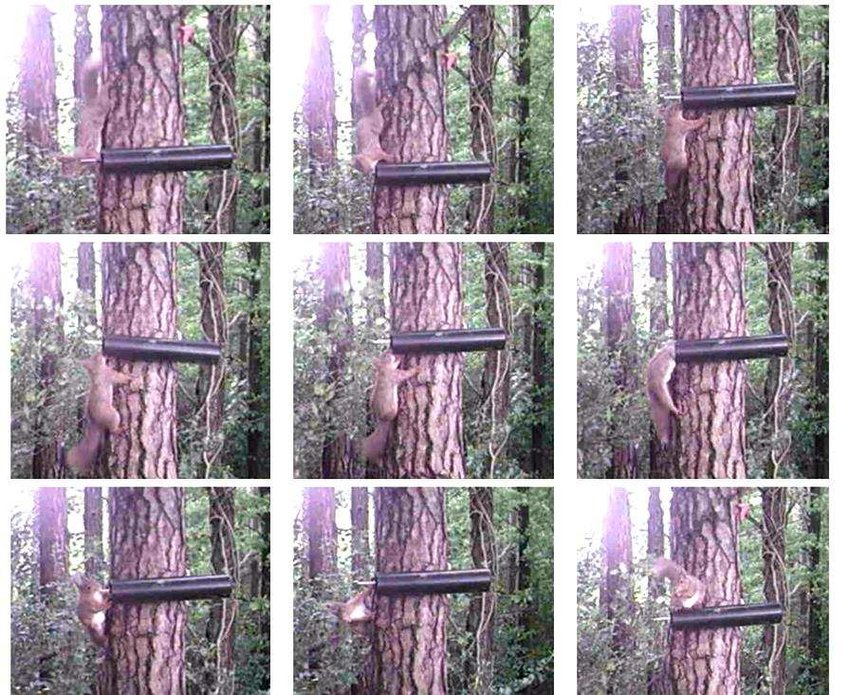
- DNA from red squirrels in Skåne?
02:30
Populations and samples
If you know the population parameter, no need for statistics

Experimental design
Observational vs experimental studies
What are the main difference between these two studies?
- I measure the biomass of wild Mercurialis annua plants found in sandy soils and in loamy soils in a nature reserve.
- I grow Mercurialis annua plants in either sandy or loamy soils from seeds, and measure there biomass after a 3 months.
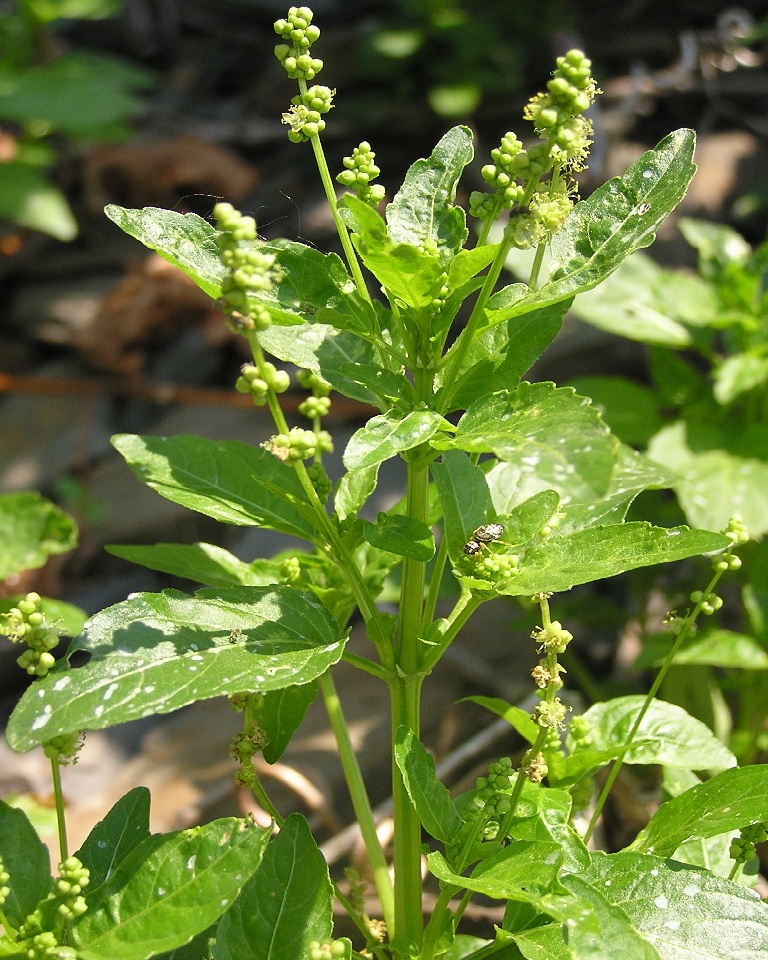
Photo by Michael Becker
02:00
Experimental design
Principles of experimental design: controlling
Try to control for differences that we can control but are not interested in.
For example:
- Water all plants the same amount
- Keep the temperature in the greenhouse the same
- Space out the plants evenly
Photo by Michael Becker
Experimental design
Principles of experimental design: randomisation
Try to account for differences that we cannot control and are not interested in.
For example:
- Randomly assign seeds to soil type (treatment)
- Randomly assign pots to rooms in a greenhouse
Photo by Michael Becker
Experimental design
Principles of experimental design: replication
Pseudoreplication
- 50 plants in each treatment
- I measure 10 leaves from each plant
- Is my sample size per treatment:
- n = 50
- n = 500
Photo by Michael Becker
02:00
Causation
Observational vs experimental studies
What are the main difference between these two studies?
- I measure the biomass of wild Mercurialis annua plants found in sandy soils and in loamy soils in a nature reserve.
- I grow Mercurialis annua plants in either sandy or loamy soils from seeds, and measure there biomass after a 3 months.
Photo by Michael Becker
Causation
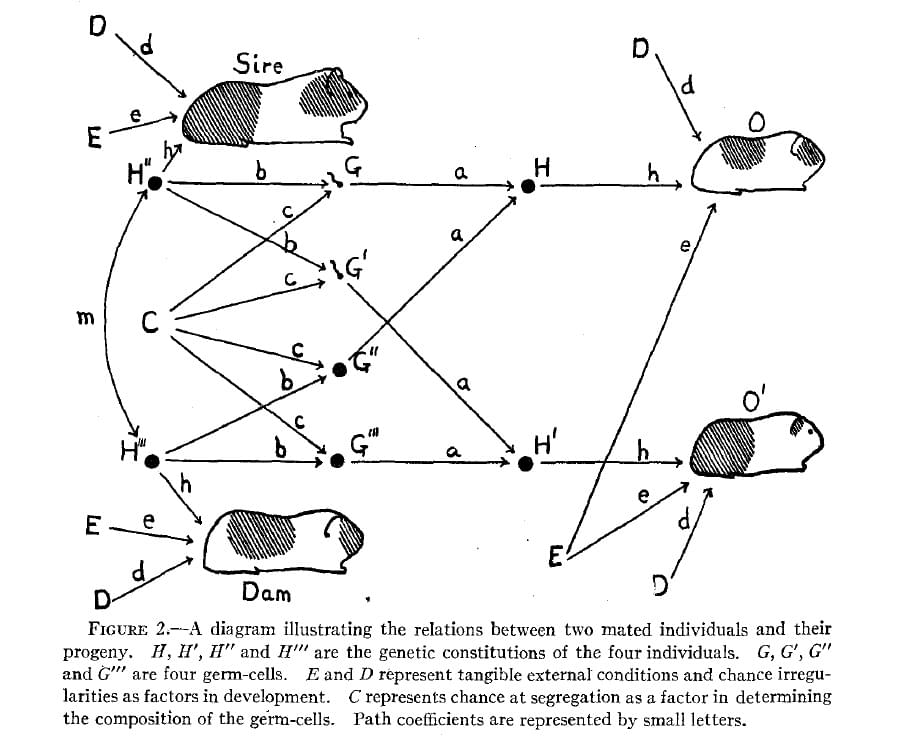
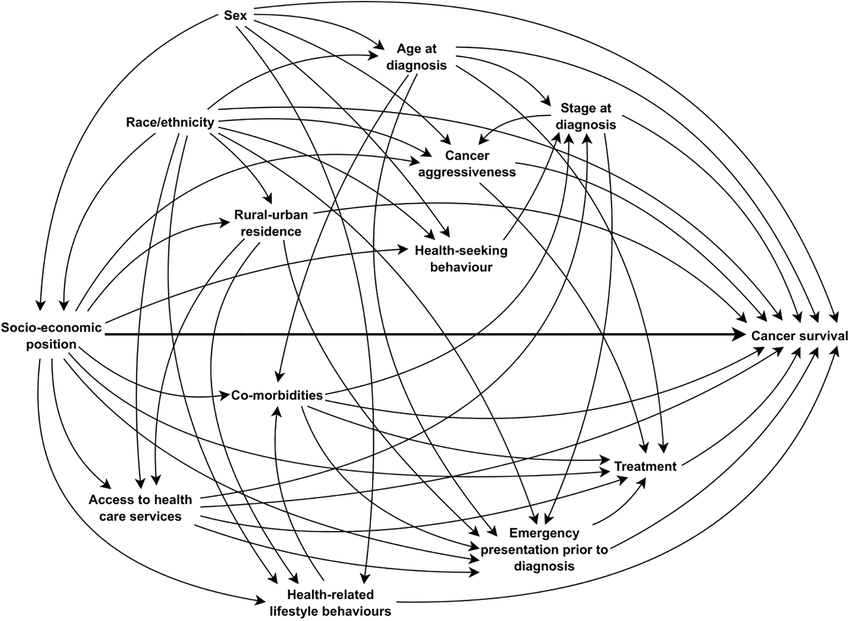
Causal reasoning via DAGs
Causation
Causal reasoning via DAGs
Causation
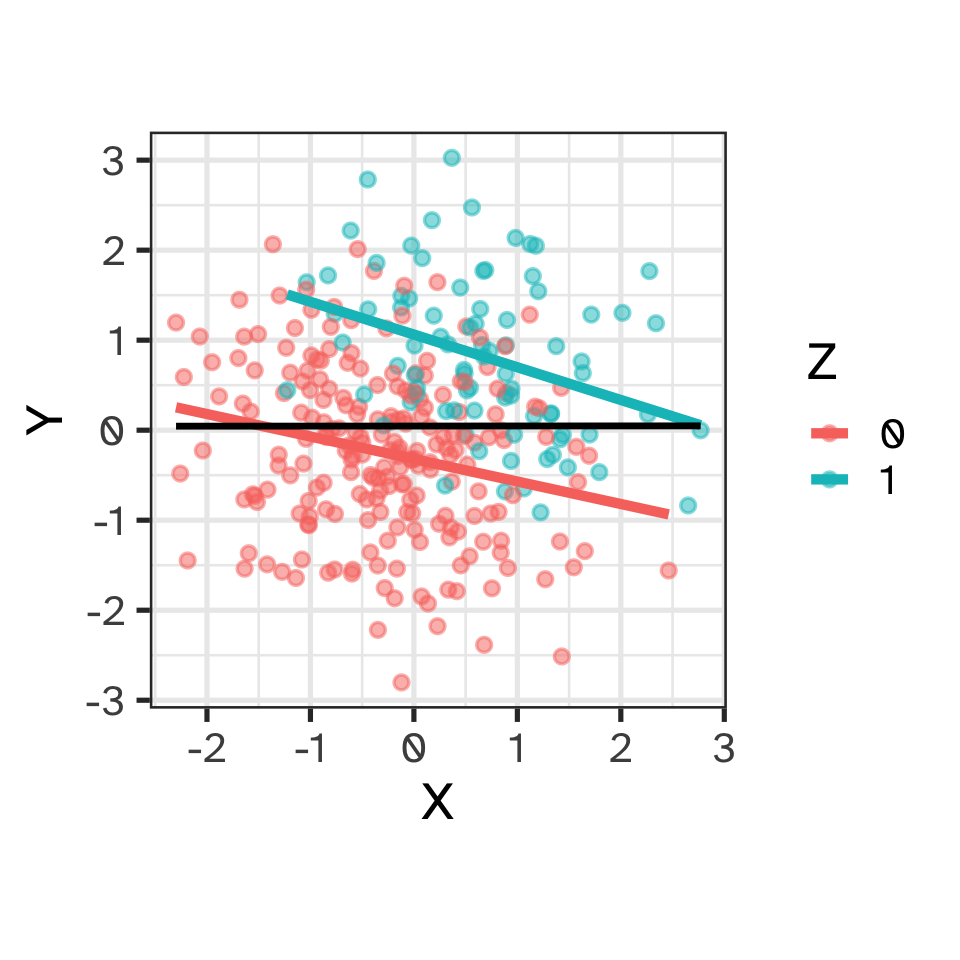
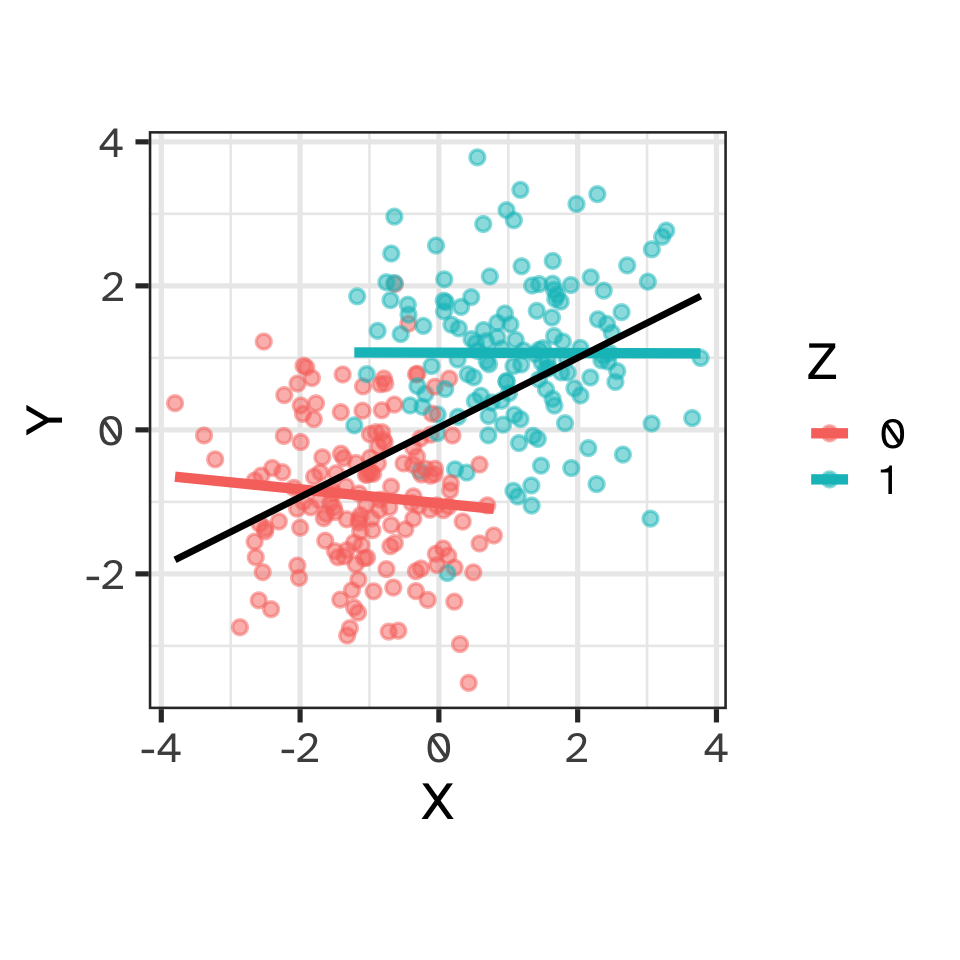
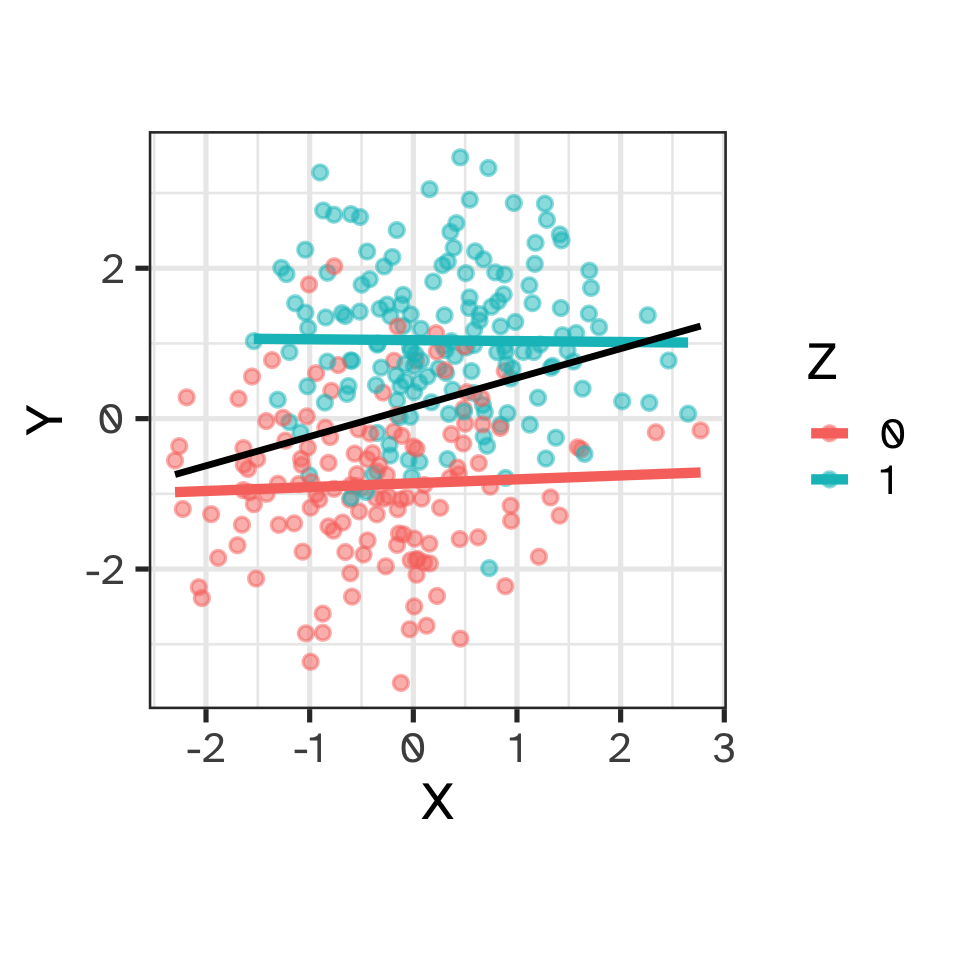
Causal reasoning via DAGs: forks
- X and Y are associated (not independent)
- Z is a “common cause”
- Once grouped by Z, no association between X and Y
Causation
Causal reasoning via DAGs: pipes
- X and Y are associated (not independent)
- The effect of X on Y is transmitted through Z
- Once grouped by Z, no association between X and Y
Causation
Causal reasoning via DAGs: colliders
- X and Y are not associated (independent)
- X and Y both influence Z
- Once grouped by Z, X and Y are associated