Comparing means of multiple groups
Lecture 4
Iain R. Moodie
BIOB11 - Experimental design and analysis for biologists
Department of Biology, Lund University
2025-04-01
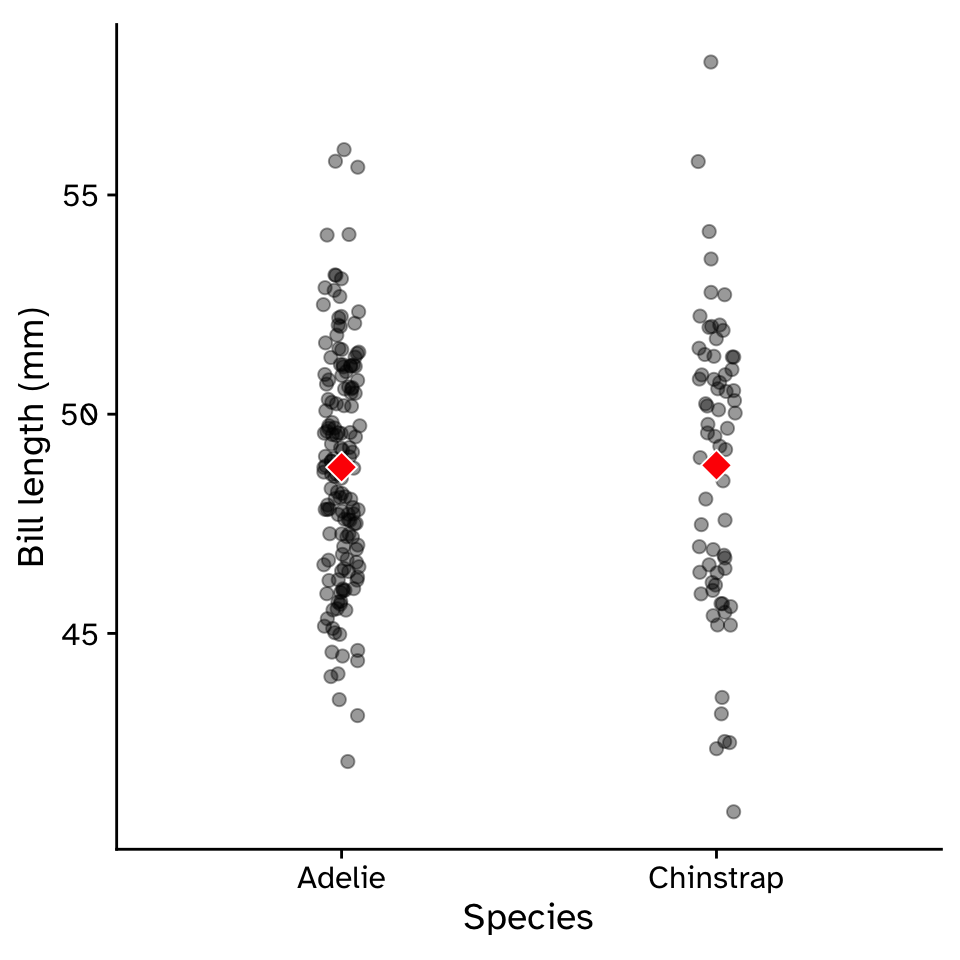
Comparing means between groups
Two groups
![]()
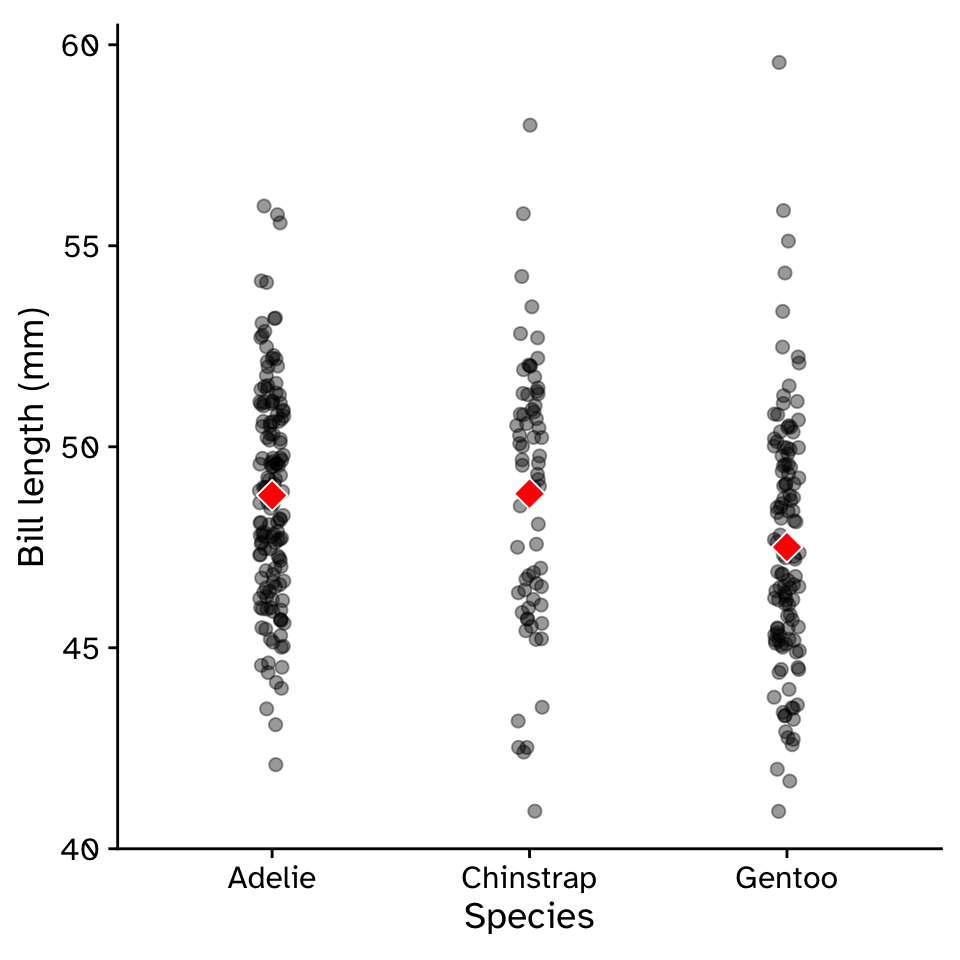
Comparing means between groups
Three or more groups
![]()
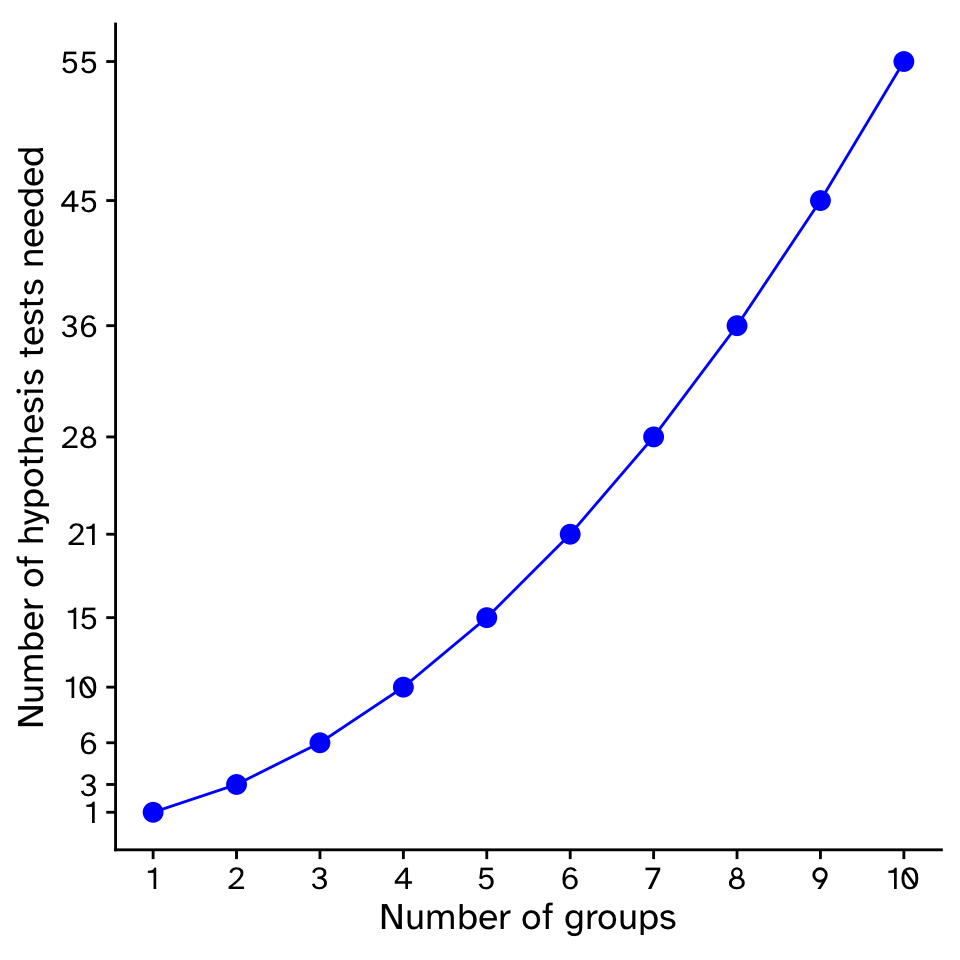
Comparing means between groups
Why not just do pairwise comparisons of means?
![]()
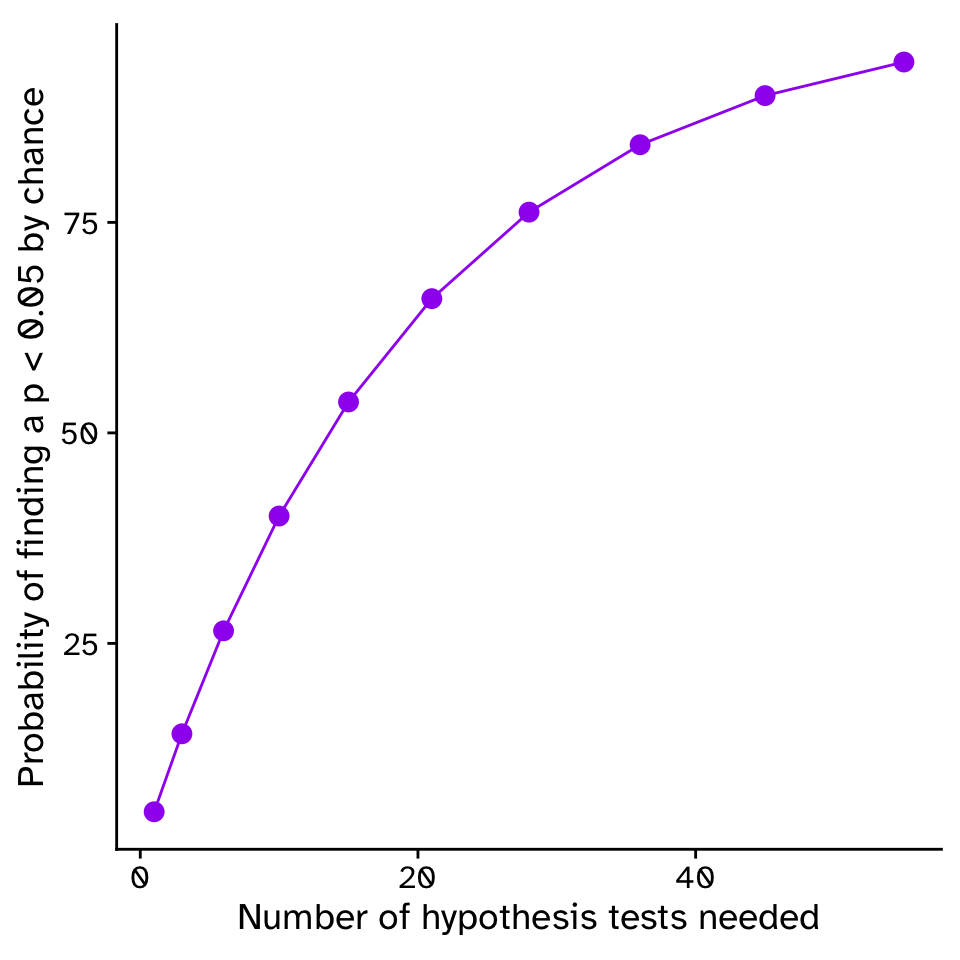
Comparing means between groups
Why not just do pairwise comparisons of means?
![]()
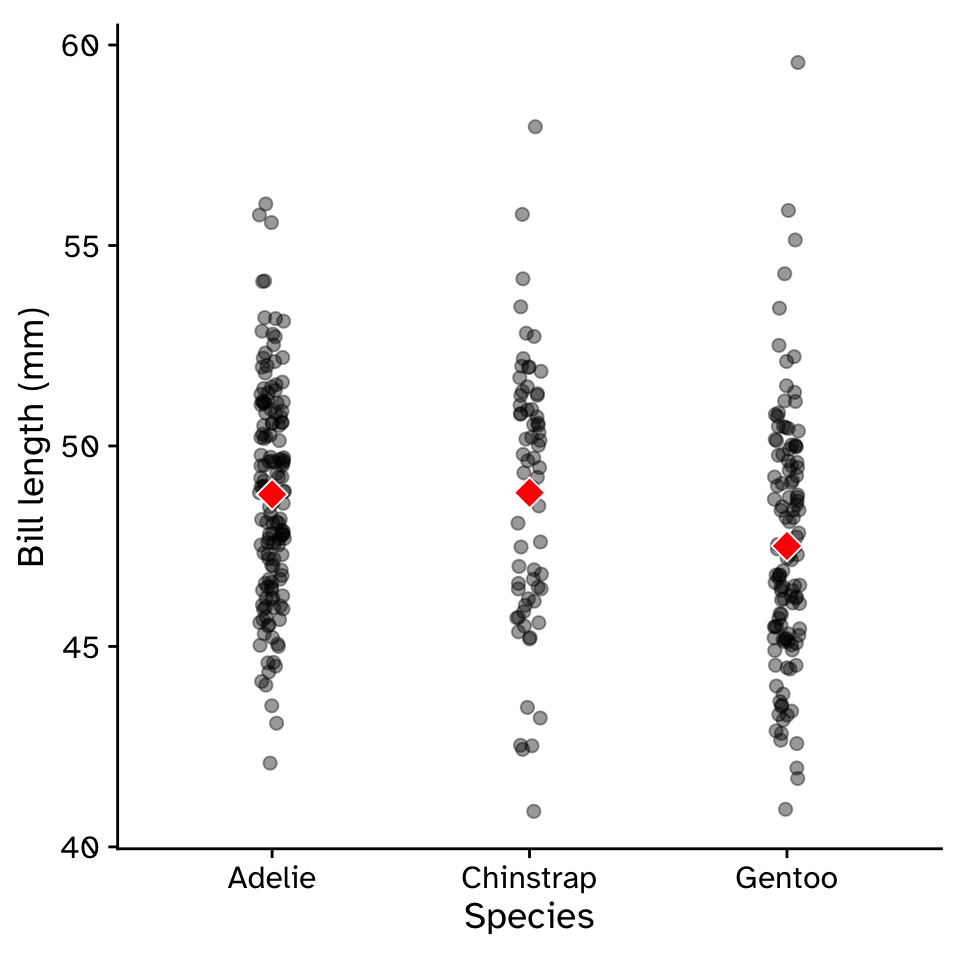
Comparing means between groups
Analysis of Variance (ANOVA)
- Null hypothesis
- The means of all groups are the same
- Mean A == Mean B == Mean C
- Alternative hypothesis
- The means of at least one group differ from the global mean
F-statistic
The ratio of variances
\[
F = \frac{\text{Variance 1}}{\text{Variance 2}}
\]
- Can (in general) be used to test if the variances are equal between sources of variance
- \(F=1\) if variances are equal
- \(F\) is very low if variance 1 < variance 2
- \(F\) is very high if variance 1 > variance 2
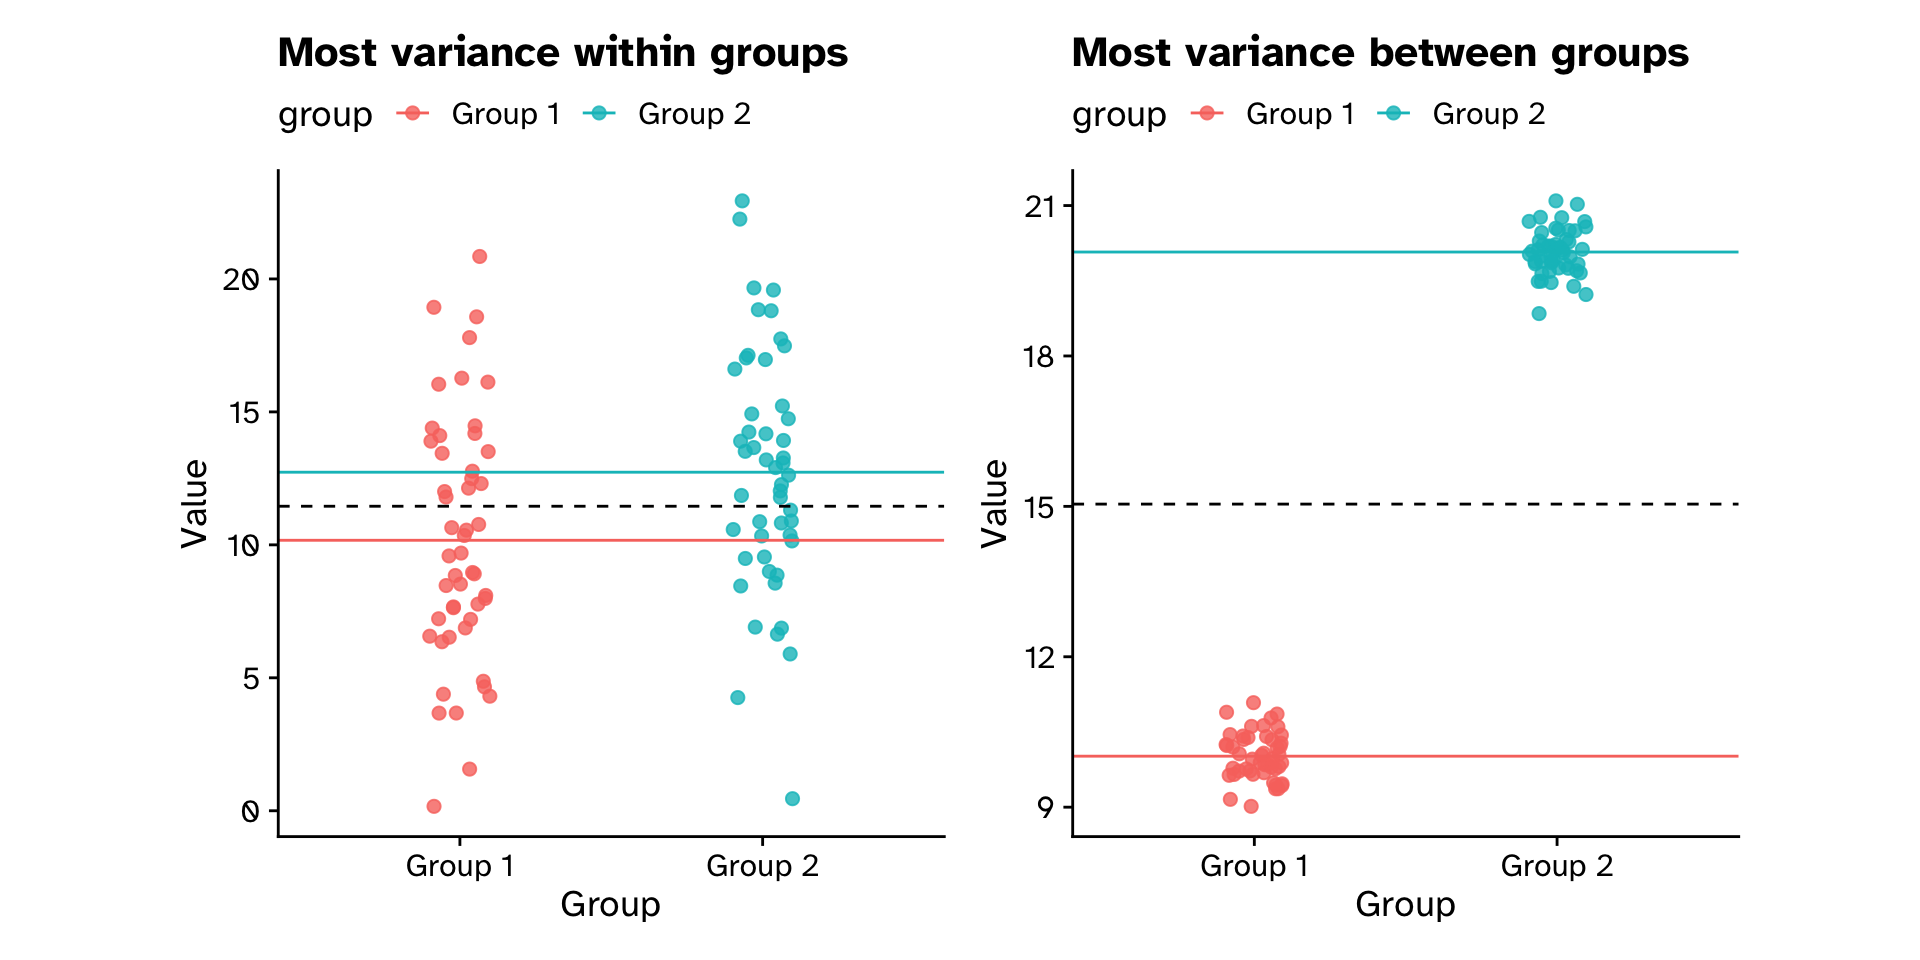
F-statistic
The ratio of between-group variance to within-group variance
\[
F = \frac{\text{Between-group variance}}{\text{Within-group variance}}
\]
\[
F = \frac{\text{Between-treatment variance}}{\text{Within-treatment variance}}
\]
\[
F = \frac{\text{Explained variance}}{\text{Unexplained variance}}
\]
\[
F = \frac{\text{Explained variance}}{\text{Residual variance}}
\]
\[
F = \frac{\text{Explained}}{\text{Error}}
\]
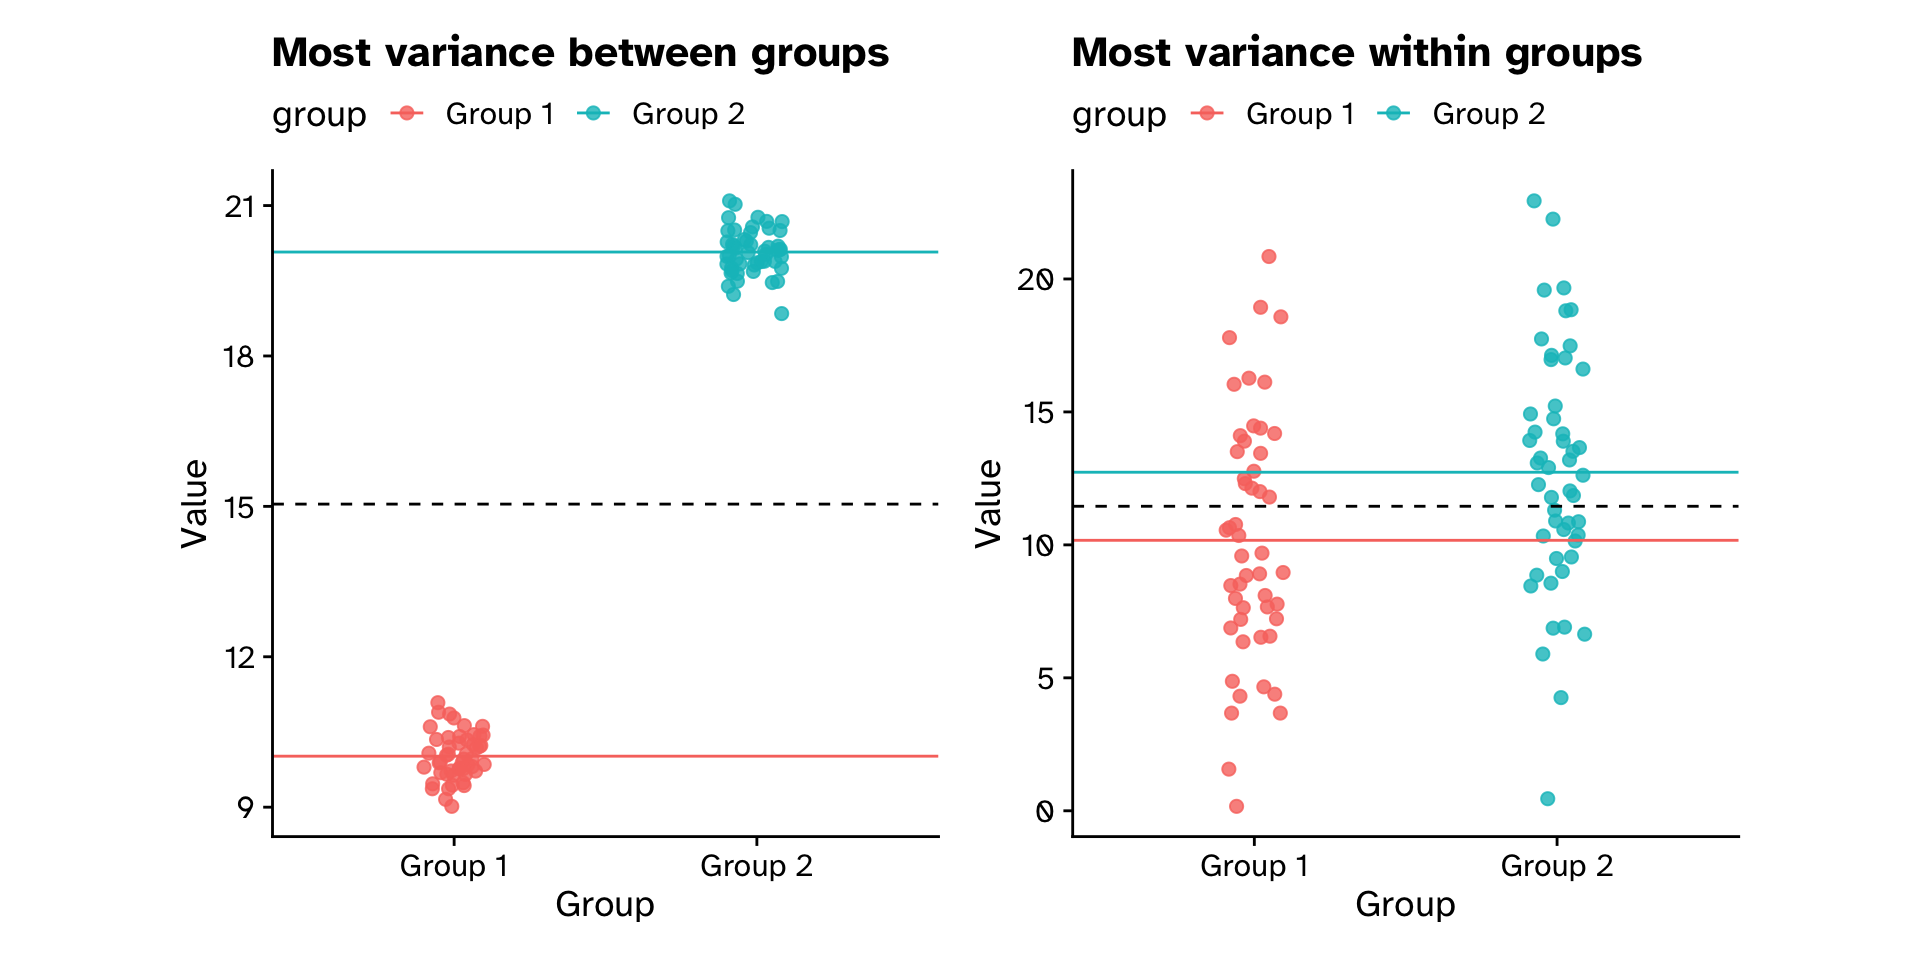
F-statistic
The ratio of between-group variance to within-group variance
![]()
Comparing means between groups
Analysis of Variance (ANOVA)
\[
F = \frac{\text{Mean variance between-group}}{\text{Mean variance within-group}}
\]
- If \(F\) is very big, more likely that means are different
- How do we calculate it?
Comparing means between groups
Analysis of Variance (ANOVA)
![]()
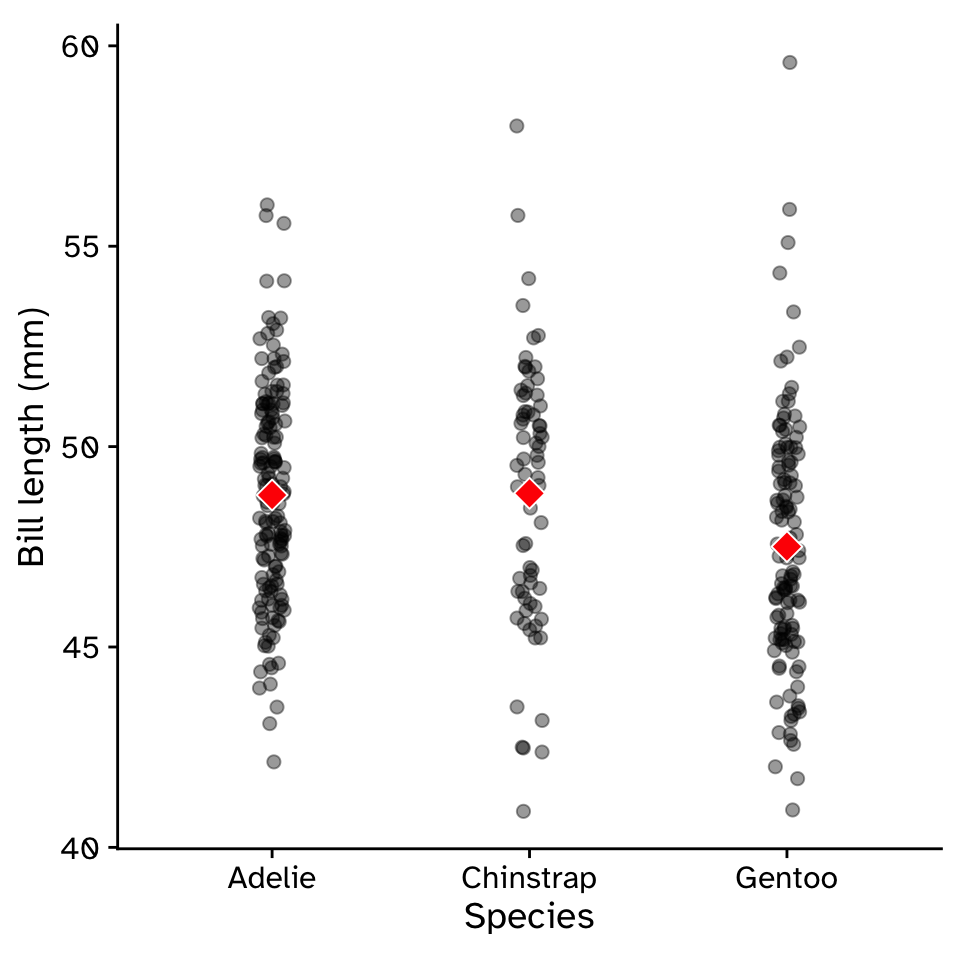
Comparing means between groups
Analysis of Variance (ANOVA)
Calculate observed \(F\) statistic:
observed_f <-
  penguins_modified |>
  specify(response = bill_length_mm, explanatory = species) |>
  calculate(stat = "F")

observed_f
Response: bill_length_mm (numeric)
Explanatory: species (factor)
# A tibble: 1 × 1
   stat
  <dbl>
1  7.60
Comparing means between groups
Analysis of Variance (ANOVA)
Generate null \(F\) distribution:
null_f <-
  penguins_modified |>
  specify(response = bill_length_mm, explanatory = species) |>
  hypothesize(null = "independence") |>
  generate(reps = 5000, type = "permute") |>
  calculate(stat = "F")

visualise(null_f) +
  labs(x = "F statistic")
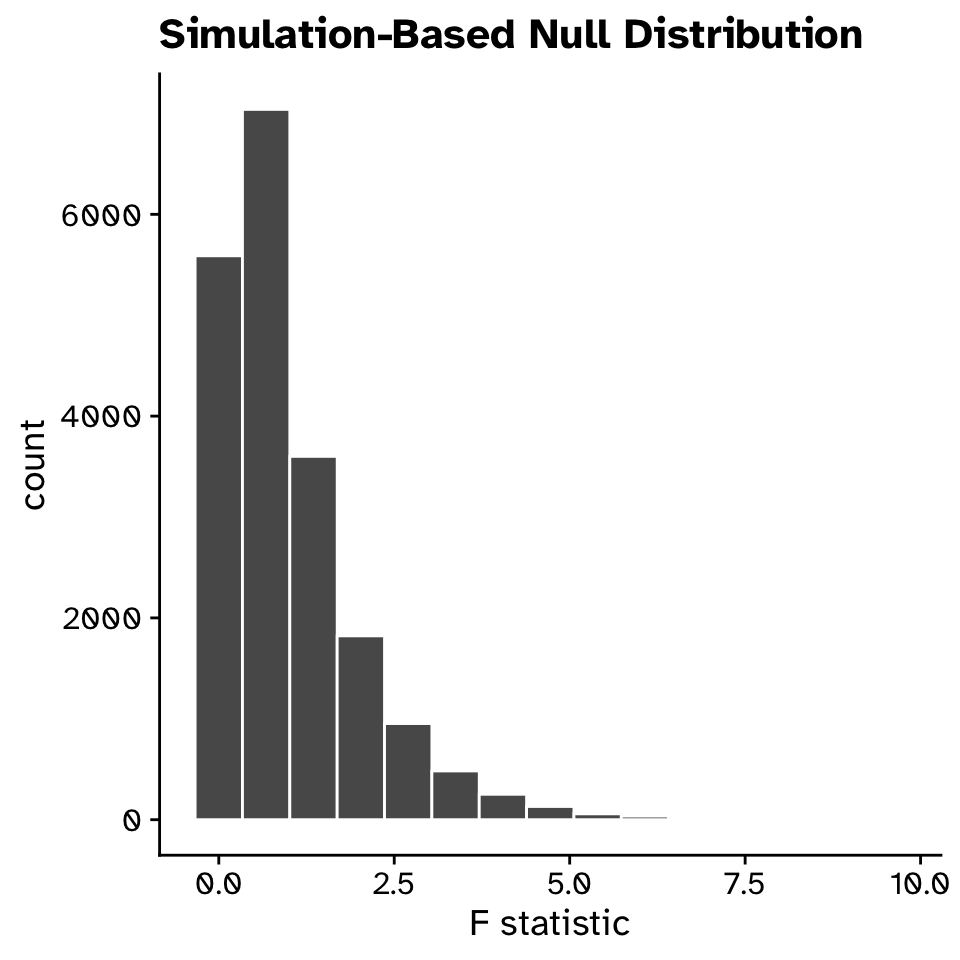
Comparing means between groups
Analysis of Variance (ANOVA)
Generate null \(F\) distribution:
![]()
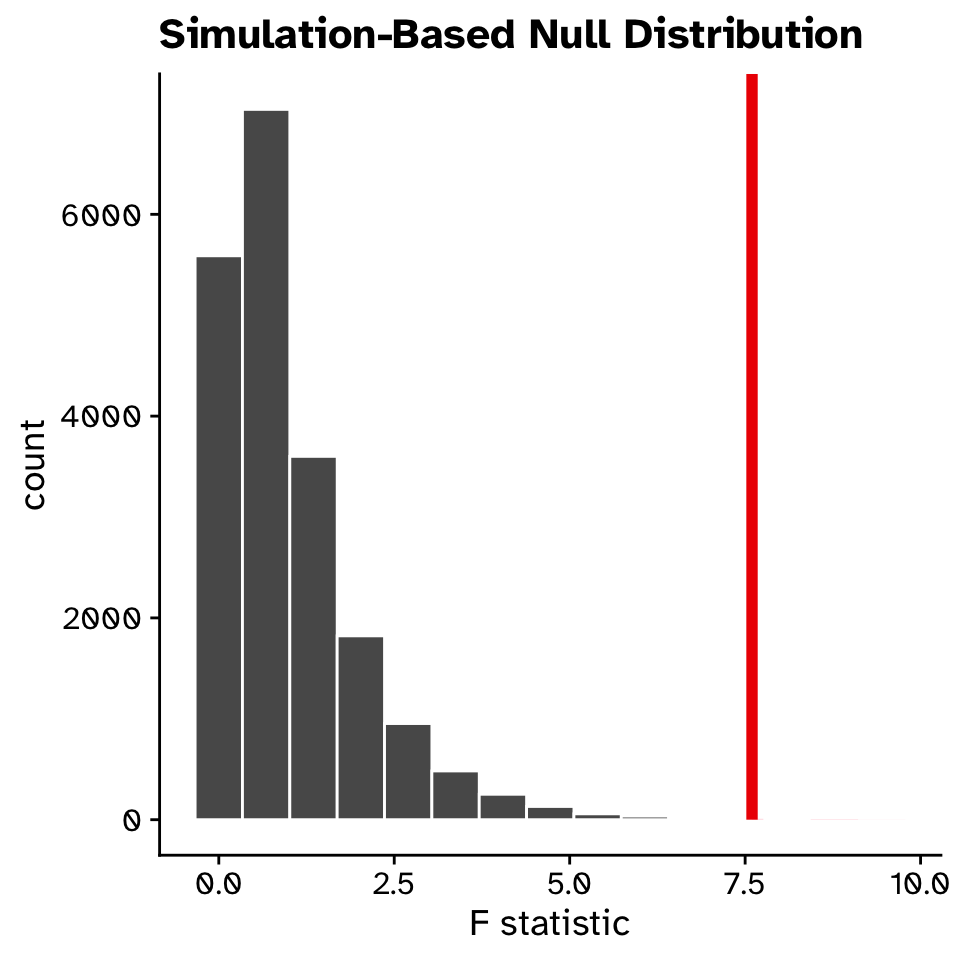
Comparing means between groups
Analysis of Variance (ANOVA)
Compare observed \(F\) against null \(F\) distribution:
visualise(null_f) +
  shade_p_value(observed_f, direction = "greater") +
  labs(x = "F statistic")
![]()
Comparing means between groups
Analysis of Variance (ANOVA)
Compare observed \(F\) against null \(F\) distribution:
null_f |>
  get_p_value(obs_stat = observed_f, direction = "greater")
# A tibble: 1 × 1
  p_value
    <dbl>
1  0.0004
Comparing means between groups
Analysis of Variance (ANOVA)
![]()
Comparing means between groups
Analysis of Variance (ANOVA)
![]()