The foundations of inference
Lecture 4
Friday 27th March, 2026
Sampling distributions
Dairy disease
A large dairy farm (\(N\)=500) has a potential outbreak of a disease. Testing for the disease is costly, so only a sample (\(n\)=50) cows are tested to estimate the population’s prevalence of the disease.
Photo from The General Line (1929)
Sampling distributions
What is a sampling distribution?

Bootstrap resampling

Quantifying sampling error
Confidence interval using a bootstrap sampling distribution

Quantifying sampling error
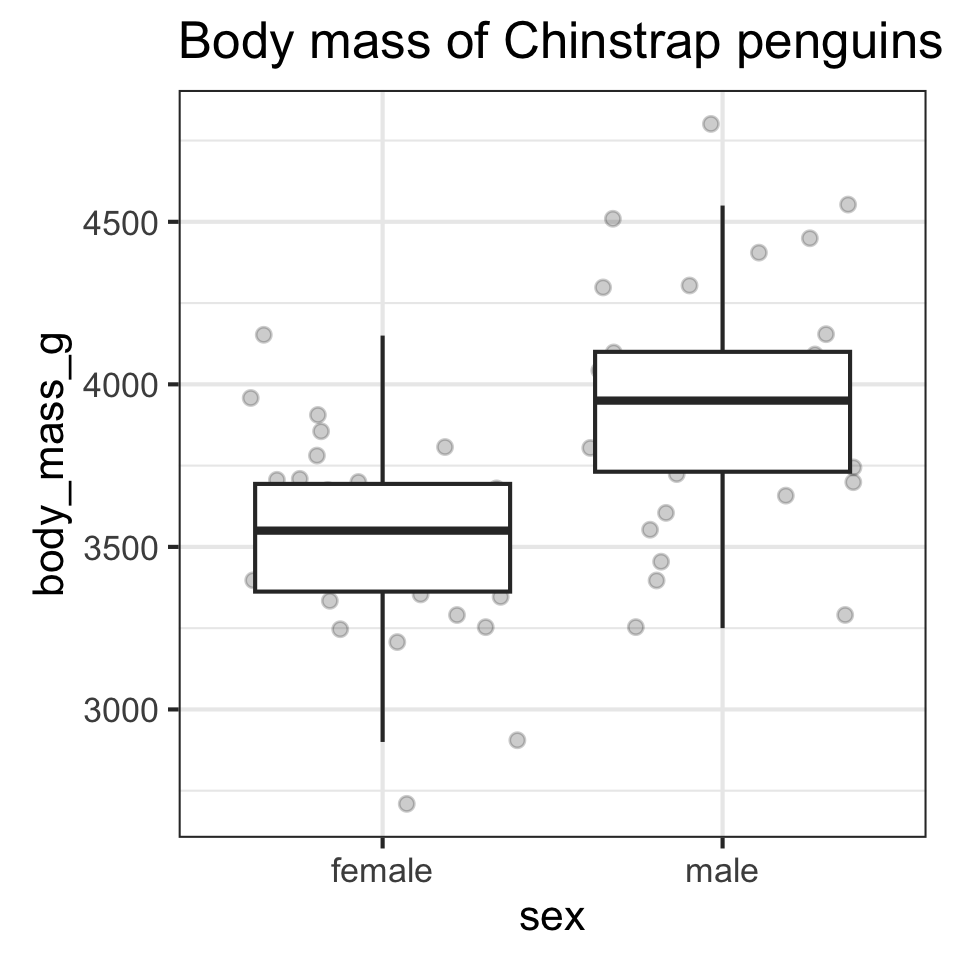
Confidence interval for differences between two independent groups
- What is the difference in average size of males and females?
- Statistic?
Quantifying sampling error
Confidence interval using a bootstrap sampling distribution
Quantifying sampling error
Confidence interval using a bootstrap sampling distribution
Quantifying sampling error
Confidence interval using a bootstrap sampling distribution