Null hypothesis testing & test statistics
Lecture 5
Iain R. Moodie
Monday 30th March, 2026
Review
Review
Confidence intervals

Review
Sample statistics we’ve encountered
- Central tendancy
- mean, median
- Spread
- range, IQR, variance, standard deviation
- Difference in central tendancies
- difference in means, difference in medians, ratios
- Counts
- counts, proportions
- Difference in counts
- difference in proportions, ratios
Review
Sampling distribution

Review
Bootstrap resampling
- Re-sample the sample with replacement to create bootstrap replicates
- Each replicate is the same size as the original dataset
- From each replicate, calculate the sample statistic to derive a sampling distribution
Review
Confidence intervals interpretation
The proportion of Adelie penguins on Biscoe was estimated to be: 0.262
Review
Confidence intervals interpretation
The proportion of Adelie penguins on Biscoe was estimated to be: 0.262 (95% CI: 0.196 - 0.327)
Review
Confidence intervals interpretation
The proportion of Adelie penguins on Biscoe was estimated to be: 0.262 (95% CI: 0.196 - 0.327)
01:30
Review
Confidence intervals interpretation
Adelie penguins are 1366 grams lighter than Gentoo penguins on Biscoe.
Review
Confidence intervals interpretation
Adelie penguins are 1366 grams lighter than Gentoo penguins on Biscoe.
Review
Confidence intervals interpretation
Adelie penguins are 1366 grams (95% 1199 - 1540 grams) lighter than Gentoo penguins on Biscoe.
01:30
Hypothesis testing
- Is our sample compatible with a certain hypothesis?
- If we collected another sample, could the conclusion have been different?
Hypothesis testing
Is our sample compatible with a certain hypothesis?
- More stricly: a method of statistical inference used to decide whether our sample provides sufficient evidence to reject a particular hypothesis
- Used to answer the questions:
- Could our results be just due to chance?
- If we collected another sample, could the conclusion have been different?
Hypothesis testing
One part of one way of conducting science
- Make observations
- Formulate a hypothesis (causal)
- Design experiment (using causal model)
- Conduct the experiment (obtain data)
- Analyze the data (is your data compatible with your hypothesis?)
- Formulate conclusion
- Synthesize results with other studies, and determine next steps
Hypothesis testing
Do female Adelie penguins have longer bills than males?
Hypothesis testing
Do female Adelie penguins have longer bills than males?
Hypothesis testing
Do female Adelie penguins have longer bills than males?
Null hypothesis
- Male and female Adelie penguins have the same length bills.
Alternative hypothesis:
- Male and female Adelie penguins have different length bills.
Hypothesis testing
Do female Adelie penguins have longer bills than males?
Hypothesis testing
Do female Adelie penguins have longer bills than males?
CI approach
- What range of differences seem plausible?
- Do the size differences seem biologically important?
- Does the CI include zero?
Null hypothesis testing approach:
- If there was truly no difference, how likely is it we would observe a difference as large as we see in our sample?
- If very likely, then difference is probably not real
- If very unlikely, then difference is probably real
Hypothesis testing
Do female Adelie penguins have longer bills than males?
CI approach
- Get sampling distribution for sample statistic
- “From a world” compatible with our data
Null hypothesis testing approach:
- Get sampling distribution for sample statistic
- “From a world” compatible with our null hypothesis
- Called a null distribution
Hypothesis testing
Do female Adelie penguins have longer bills than males?
Null hypothesis
- Male and female Adelie penguins have the same length bills.
Alternative hypothesis:
- Male and female Adelie penguins have different length bills.
Hypothesis testing
Do female Adelie penguins have longer bills than males?

Hypothesis testing
Do female Adelie penguins have longer bills than males?
Hypothesis testing
Do female Adelie penguins have longer bills than males?
Hypothesis testing
Do female Adelie penguins have longer bills than males?
Hypothesis testing
Do female Adelie penguins have longer bills than males?
- By comparing null distribution and observed statistic, can calcualte a p value
- Probability of observing our original statistic, or one more extreme, assuming the null hypothesis is true
Hypothesis testing
Do female Adelie penguins have longer bills than males?
p = 0.01
Hypothesis testing
Do female Adelie penguins have longer bills than males?
p = 0.01
What should I conclude? Why?
01:30
Hypothesis testing
Overview
Other helpful sample statistics
- F-statistic
- \(\chi^2\) (chi-squared)
Difference between >2 groups in a continuous variable
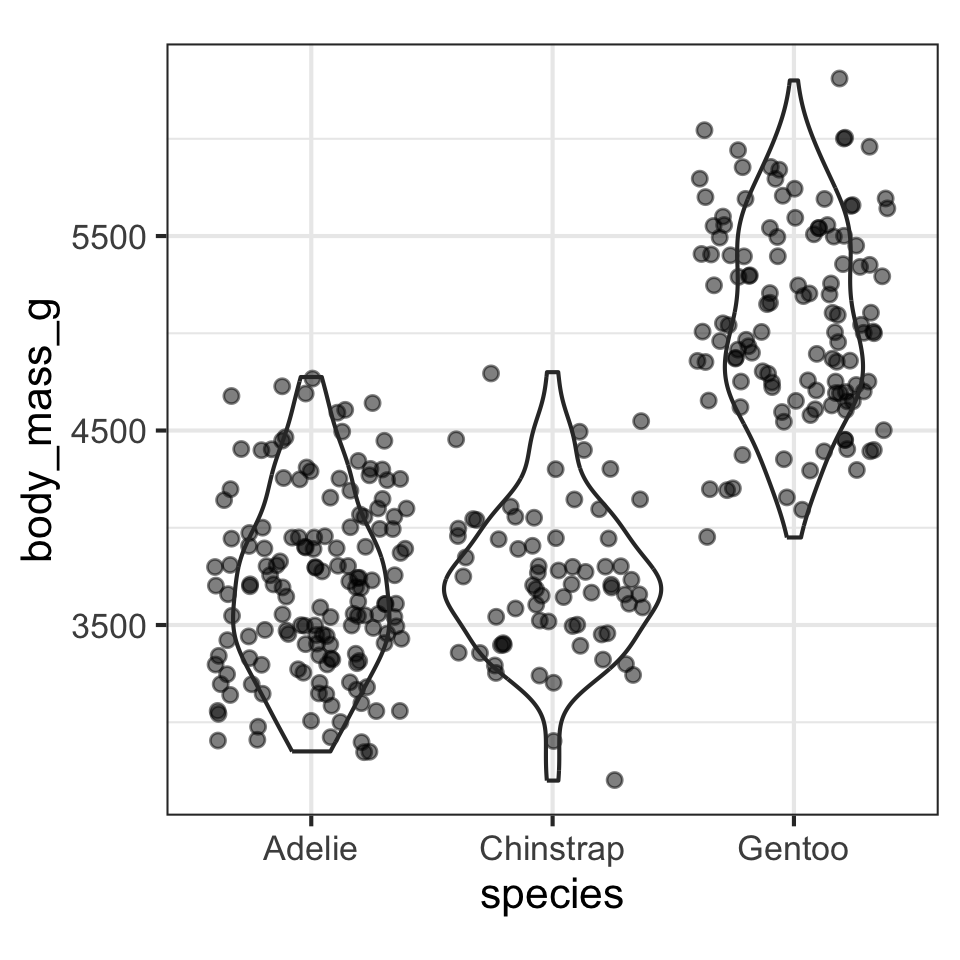
Difference between >2 groups in a continuous variable
F-statistic
\[ F = \frac{\text{Variance 1}}{\text{Variance 2}} \]
- Can (in general) be used to test if the variances are equal between sources of variance
- \(F=1\) if variances are equal
- \(F\) is very low if variance 1 < variance 2
- \(F\) is very high if variance 1 > variance 2
Difference between >2 groups in a continuous variable
Analysis of Variance (ANOVA)
\[ F = \frac{\text{Mean variance between-group}}{\text{Mean variance within-group}} \]
- If \(F\) is very big, more likely that means are different
Difference between >2 groups in a continuous variable
Analysis of Variance (ANOVA)
- If you want to know if >2 groups differ in their means, use F-statistic
- Null hypothesis
- The means of all groups are the same
- Mean A == Mean B == Mean C
- Alternative hypothesis
- The means of at least one group differ from the global mean
Difference between >2 groups in a continuous variable
Analysis of Variance (ANOVA)
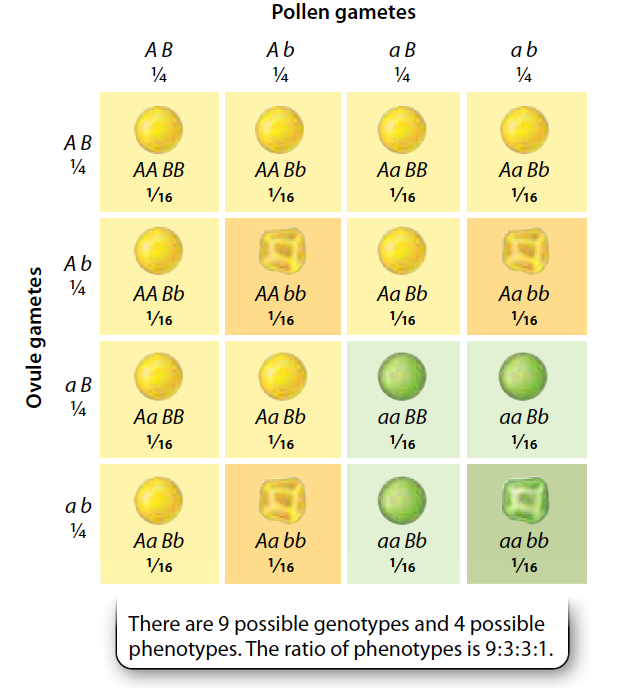
Are 2 or more distributions different?
\(\chi^2\) Goodness of fit
- Does the observed data differ from an expected distribution?
- Similar to how F-statistic allows for difference in means for many groups
- \(\chi^2\) allows for difference in proportions for many categories
Are 2 or more distributions different?
\(\chi^2\) Goodness of fit
Are 2 or more distributions different?
\(\chi^2\) Goodness of fit
Are 2 or more distributions different?
\(\chi^2\) Goodness of fit
Are 2 or more distributions different?
\(\chi^2\) Goodness of fit
\[ \chi^2 = \sum \frac{(Observed_i - Expected_i)^2}{Expected_i} \]
Are 2 or more distributions different?
\(\chi^2\) Goodness of fit
Are 2 or more distributions different?
\(\chi^2\) Goodness of fit
Are 2 or more distributions different?
\(\chi^2\) Goodness of fit
- Null hypothesis:
- The sample came from the hypothesised distribution
- The sample distribution is not different from the hypothesised distribution
- Alternative hypotheis:
- The sample came from a different distribution to the one hypothesised
- The sample distribution is different from the hypothesised distribution
Are 2 or more distributions different?
\(\chi^2\) Goodness of fit
Are 2 or more distributions different?
\(\chi^2\) Goodness of fit
Are two categorical variables associated with each other?
\(\chi^2\) Test of independence
Are two categorical variables associated with each other?
\(\chi^2\) Test of independence
Are two categorical variables associated with each other?
\(\chi^2\) Test of independence
- Null hypothesis:
- The two categorical variables are not associated with each other
- The two categorical variables are independent
- Alternative hypothesis:
- The two categorical variables are associated with each other
- The two categorical variables are not independent
Are two categorical variables associated with each other?
\(\chi^2\) Test of independence