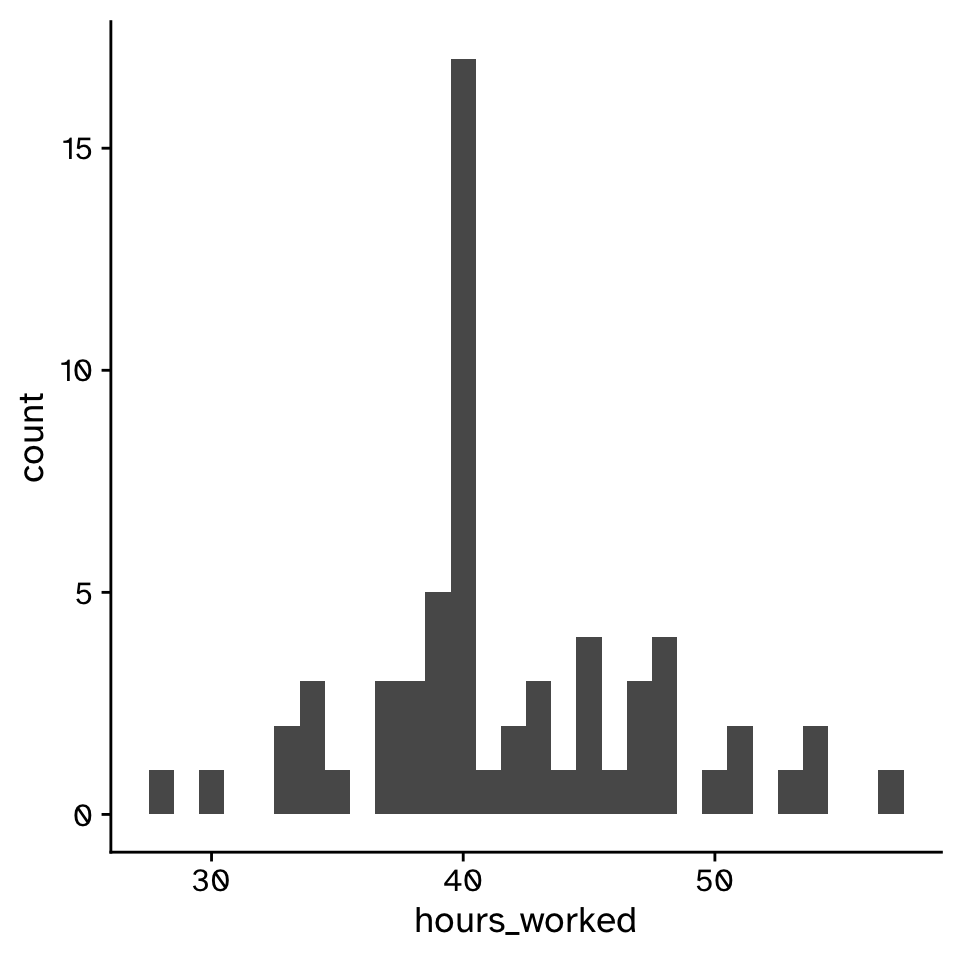
# A tibble: 62 × 1
   hours_worked
          <dbl>
 1         37.6
 2         40
 3         40.5
 4         40
 5         39.9
 6         34.1
 7         40
 8         34.8
 9         47.8
10         39.3
# ℹ 52 more rowsTheory based statistics (when sample sizes are small)
Lecture 5
Iain R. Moodie
BIOB11 - Experimental design and analysis for biologists
Department of Biology, Lund University
2025-04-01
Re-sampling vs theory based statistics
Differences
- Re-sampling:
- Relies on computational methods such as bootstrapping or permutation tests
- Does not require strict assumptions about the population distribution
- Uses the observed data to generate a sampling distribution
- Often computationally intensive
Re-sampling vs theory based statistics
Differences
- Theory-based statistics:
- Relies on mathematical models and assumptions (e.g., normality, independence)
- Uses theoretical distributions to approximate the sampling distribution
- Requires smaller computational effort compared to re-sampling
- Assumptions must be met for valid results*
Re-sampling vs theory based statistics
What we have done and the theory based alternatives
- Is a mean different from a point value?
- 1 sample t-test (1 sample sign test)
- Are the means of two independant groups different from each other?
- 2 sample t-test (Mann-Whitney U test)
- Are the means of two paired groups different from each other?
- paired sample t-test (Wilcoxon matched pairs test)
- Are the means of three or more groups different from each other?
- one-way ANOVA (Kruskal-Wallis test)
- Is there a relationship between two categorical variables?
- Chi-square test
- Does a proportion differ from a point value?
- 1 prop sample test
Re-sampling vs theory based statistics
Is a mean number of hours worked by a PhD student greater than 40?
Re-sampling vs theory based statistics
Is a mean number of hours worked by a PhD student greater than 40?
Re-sampling vs theory based statistics
Is a mean number of hours worked by a PhD student greater than 40?
- Null hypothesis
- The mean number of hours worked is not different from 40
- Alternative hypothesis
- The mean number of hours worked is greater than 40
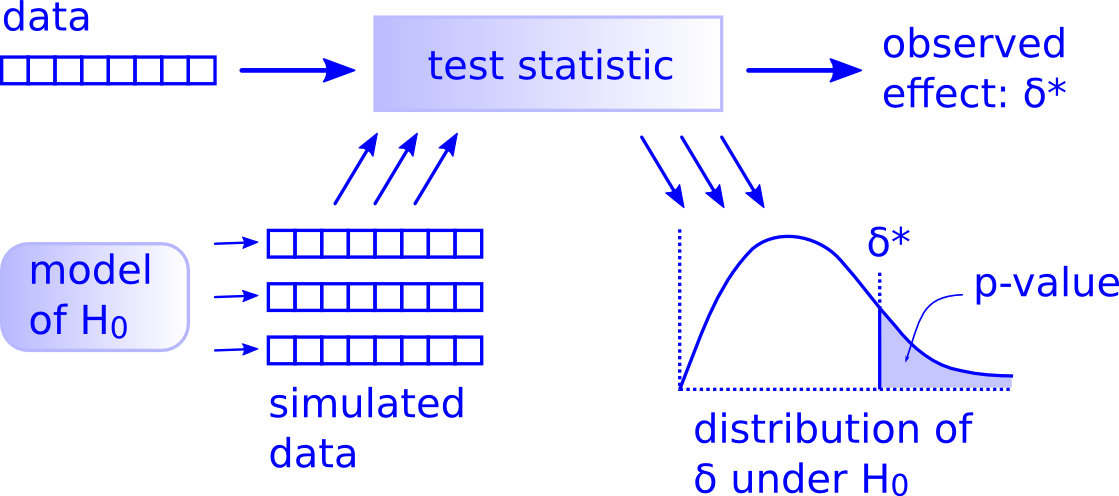
Re-sampling vs theory based statistics
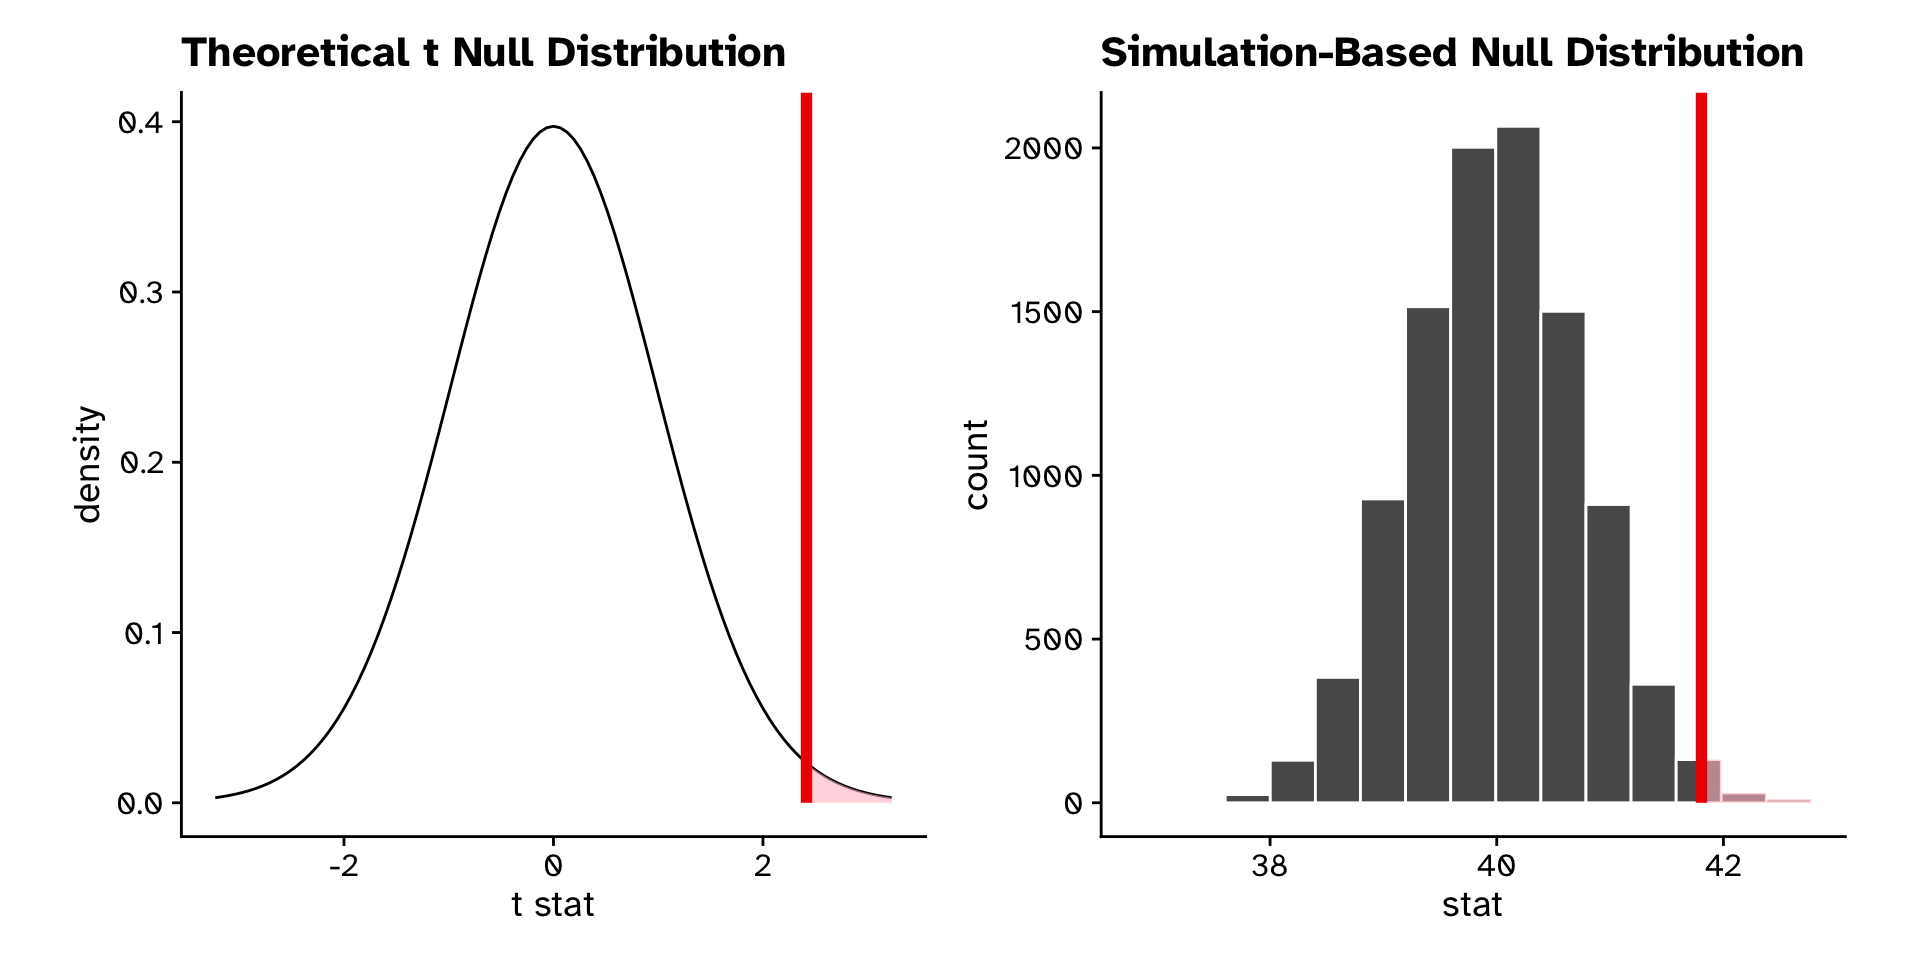
Resampling approach
Re-sampling vs theory based statistics
Resampling approach
Re-sampling vs theory based statistics
Resampling approach
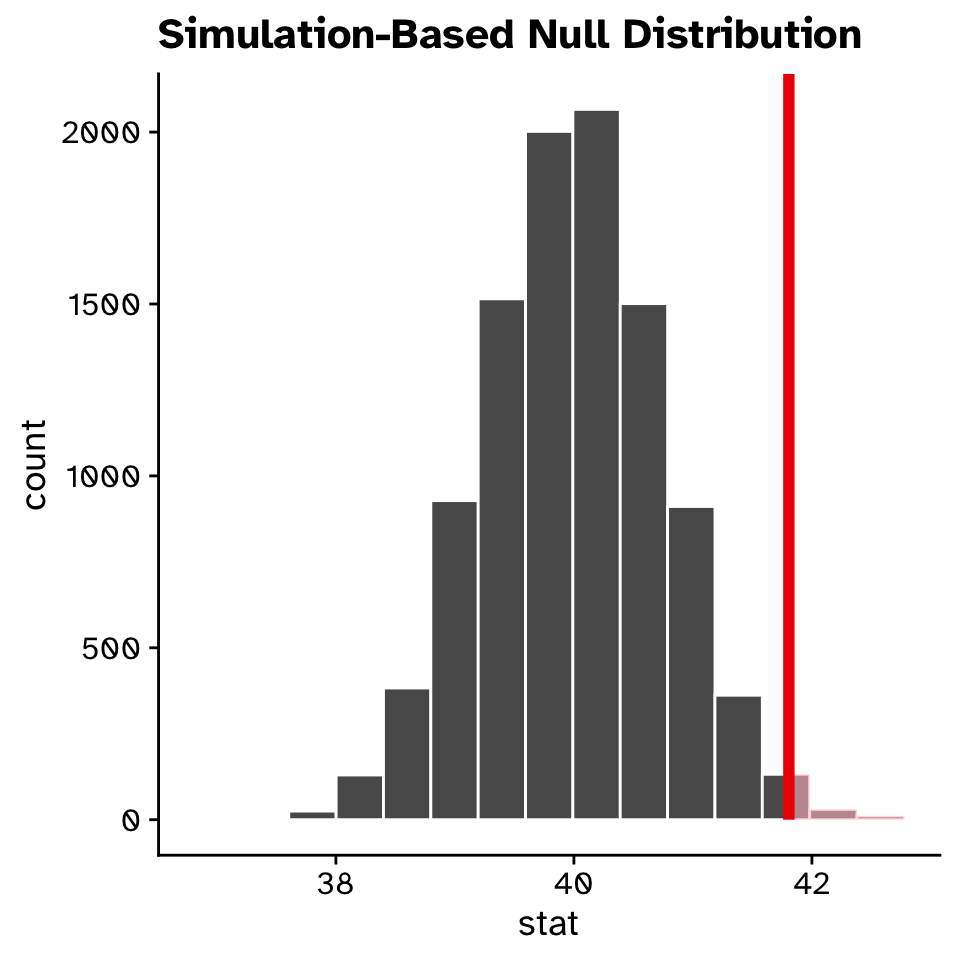
Re-sampling vs theory based statistics
Resampling approach
Re-sampling vs theory based statistics
Resampling approach
If the true mean number of hours worked per week was really 40, our approximation of the probability that we would see a test statistic as or more extreme than 41.8 is approximately 0.0082.
Re-sampling vs theory based statistics
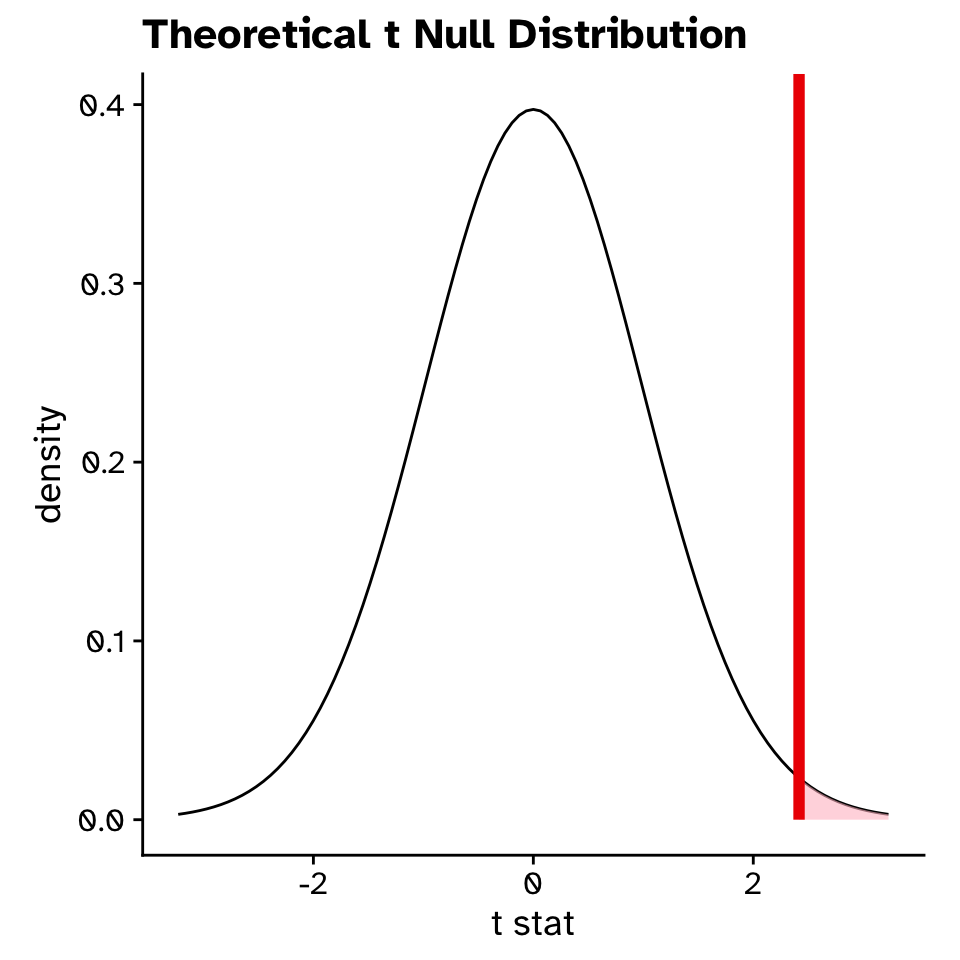
Theory approach (1 sample t-test)
\[ t = \frac{\bar{x} - \mu_0}{s / \sqrt{n}} \]
Re-sampling vs theory based statistics
Theory approach (1 sample t-test)
Re-sampling vs theory based statistics
Theory approach (1 sample t-test)
Re-sampling vs theory based statistics
Theory approach (1 sample t-test)
Re-sampling vs theory based statistics
Comparison
Re-sampling vs theory based statistics
Which to use?
- Theory
- Makes assumptions about the distribution of your sample (often normal dist., equal variances)
- A way of adding extra information in (especially when sample sizes are small)
- Extremely quick to calculate
Re-sampling vs theory based statistics
Which to use?
- Resampling
- Makes less assumptions about the distribution of your sample (not always a good thing!)
- Only information about the true distribution of the data can come from the sample
- Requires larger sample sizes to be accurate
- Takes longer to calculate
Re-sampling vs theory based statistics
What unites them?
- Your sample is representative of the population you want to make inferences about
- Collecting more data is always going to lead to more accurate inferences
- Neither are magic
- Garbage in, garbage out
- Vunerable to “p-hacking” and other unethical uses
Re-sampling vs theory based statistics
What unites them?