BIOS14 - Processing and Analysis of Biological Data
📈 data visualisation
💻 programming (R)
👩🎓 postgrad
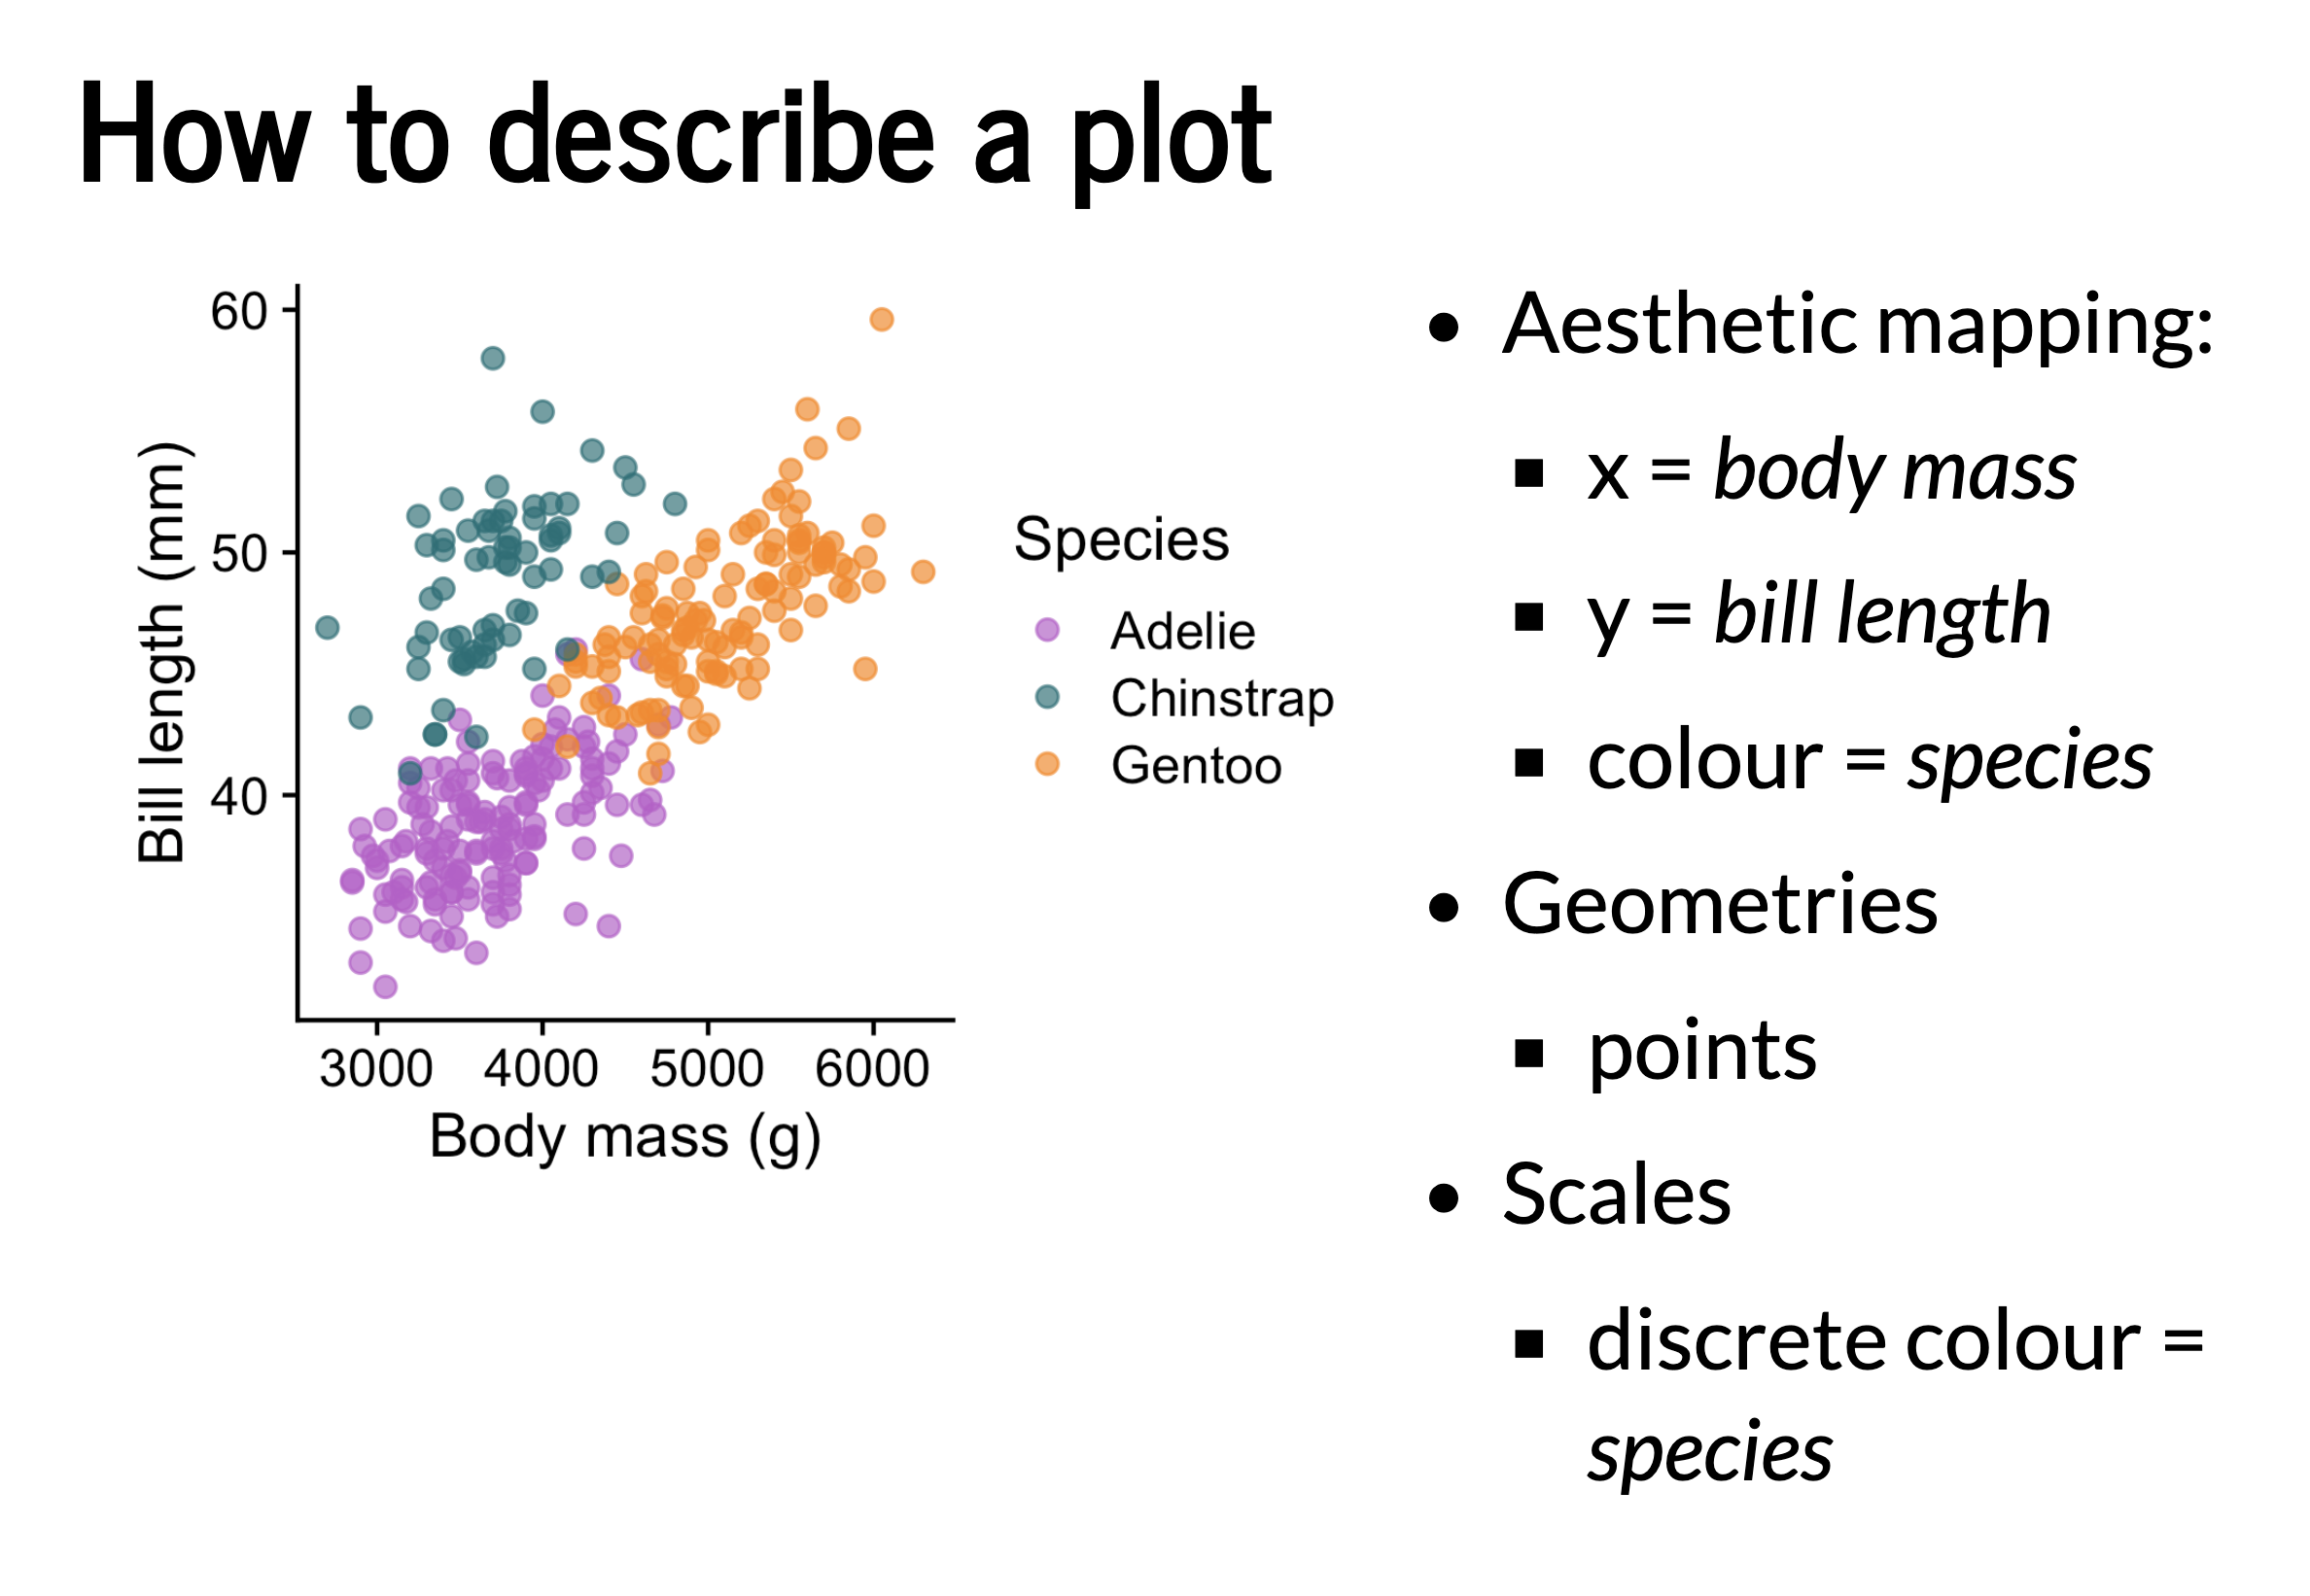
BIOS14 is a Master’s level statistics course. I give a 1 hour guest lecture on data visualisation using the grammer of graphics (Wilkinson et al. 2005), and its implementation in ggplot2 (Wickham 2016).
References
Wickham, H. 2016. ggplot2: Elegant Graphics for Data Analysis. Springer-Verlag New York.
Wilkinson, L., D. Wills, D. Rope, A. Norton, and R. Dubbs. 2005. The grammar of graphics. Statistics and computing. Springer New York.